Read in the separate data files. Make sure you have the tidyverse package loaded.
# load packageslibrary(tidyverse)
── Attaching core tidyverse packages ──────────────────────── tidyverse 2.0.0 ──
✔ dplyr     1.1.4     ✔ readr     2.1.5
✔ forcats   1.0.0     ✔ stringr   1.5.1
✔ ggplot2   3.5.1     ✔ tibble    3.2.1
✔ lubridate 1.9.3     ✔ tidyr     1.3.1
✔ purrr     1.0.2
── Conflicts ────────────────────────────────────────── tidyverse_conflicts() ──
✖ dplyr::filter() masks stats::filter()
✖ dplyr::lag()    masks stats::lag()
ℹ Use the conflicted package (<http://conflicted.r-lib.org/>) to force all conflicts to become errors
# Load the separate datasetsfellowship <-read_csv("../data/The_Fellowship_Of_The_Ring.csv")
Rows: 3 Columns: 4
── Column specification ────────────────────────────────────────────────────────
Delimiter: ","
chr (2): Film, Species
dbl (2): Female, Male

ℹ Use `spec()` to retrieve the full column specification for this data.
ℹ Specify the column types or set `show_col_types = FALSE` to quiet this message.
tt <-read_csv("../data/The_Two_Towers.csv")
Rows: 3 Columns: 4
── Column specification ────────────────────────────────────────────────────────
Delimiter: ","
chr (2): Film, Species
dbl (2): Female, Male

ℹ Use `spec()` to retrieve the full column specification for this data.
ℹ Specify the column types or set `show_col_types = FALSE` to quiet this message.
Use the bind_rows function to merge the three data sets into a single data set. We haven’t seen this function yet, look it up. Call the new merged data frame lotr (for “lord of the rings”).
# bind_rows() stacks data frames on top of each otherlotr <-bind_rows(fellowship, tt, rotk)
We later want to plot gender differences. Have a look at the data. Why is it not yet in a tidy format? Explain. Then use pivot_longer to reshape the data frame by adding two new variables, Gender and Words, to the data frame.
# Make this wide data tidylotr <- lotr |># This is the new way to make data longpivot_longer(cols =c(Female, Male), names_to ="Gender", values_to ="Words")
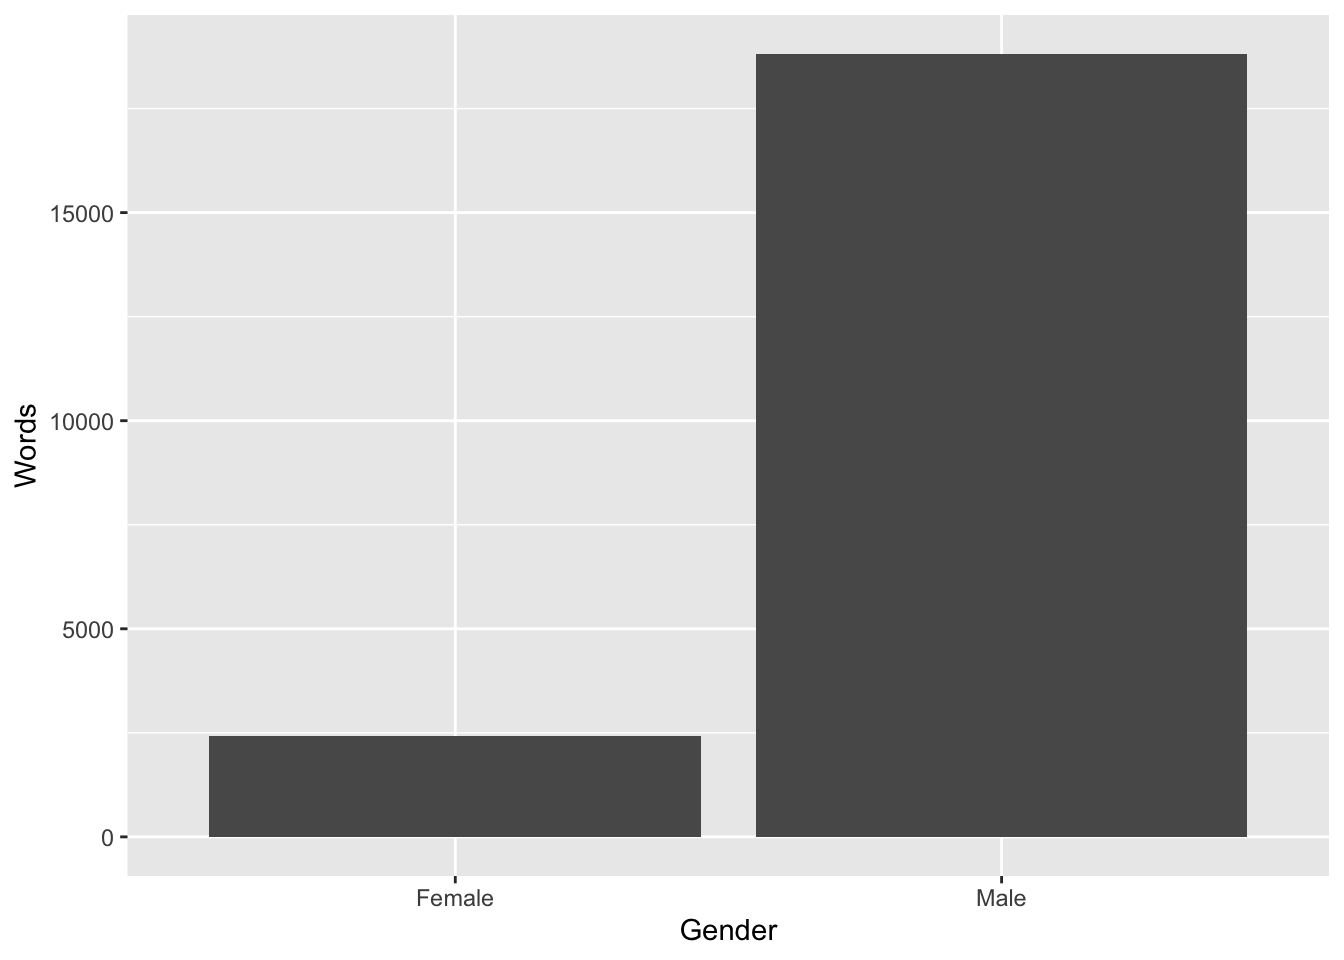
Does a certain gender dominate a movie? (Hint: Make a new summary data frame for which you group by Gender and then count sum the words.)
Graph your summarized data. (Hint: use geom_col and the Words and Gender variables.)
ggplot(summary_data, aes(x = Gender, y = Words)) +geom_col()
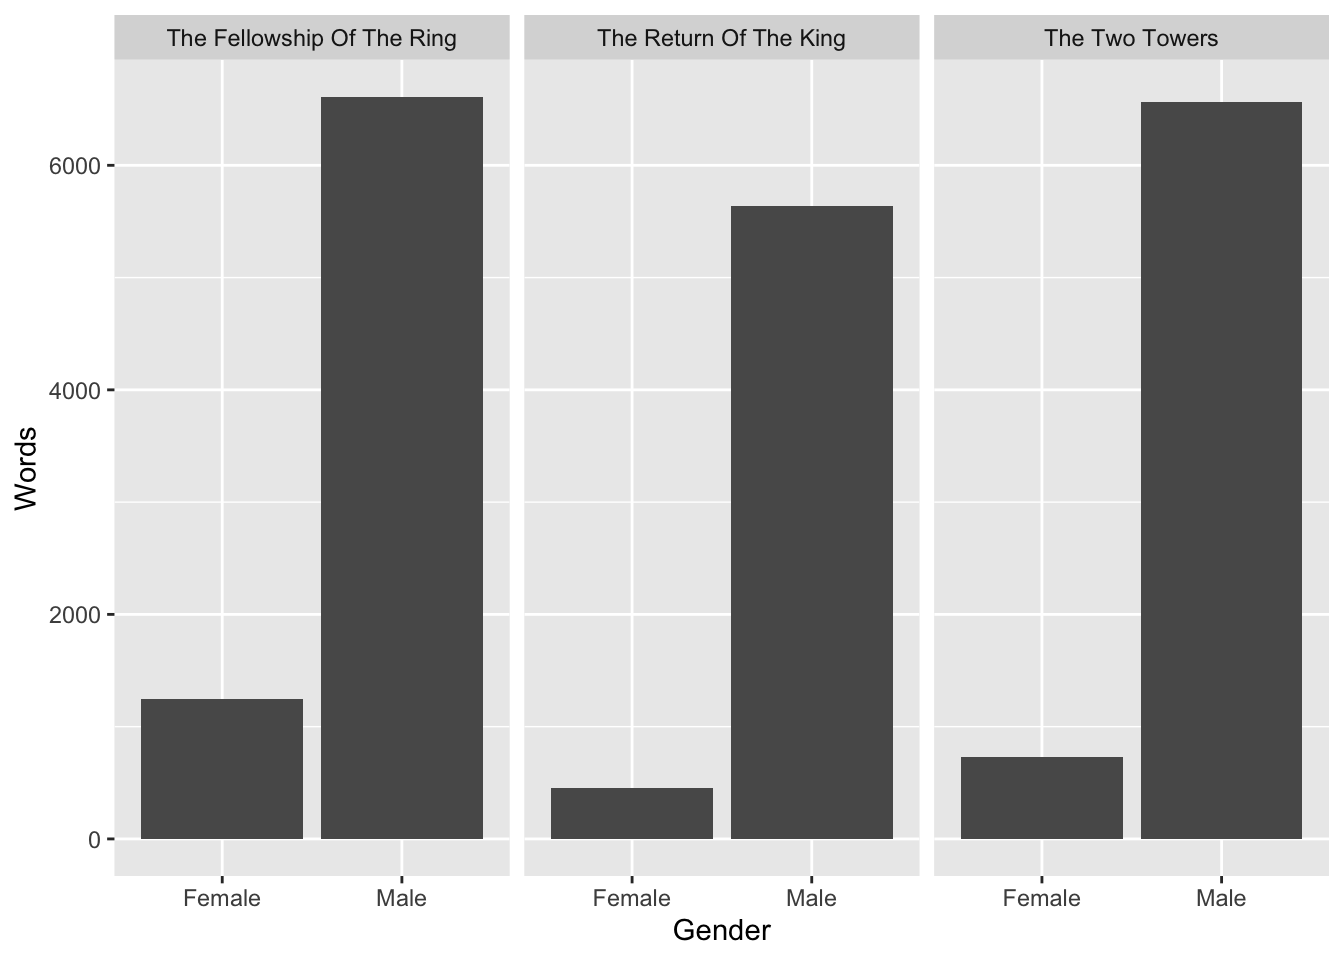
You’ve just plotted the averages across films. (Hint: Make a new summary data frame for which you group by both Gender and Film and then count sum the words.)
`summarise()` has grouped output by 'Gender'. You can override using the
`.groups` argument.
Try to make a new plot in which you differentiate between the different films (Hint: use faceting by Gender or Film).
ggplot(summary_data, aes(x = Gender, y = Words)) +geom_col() +facet_wrap(vars(Film))
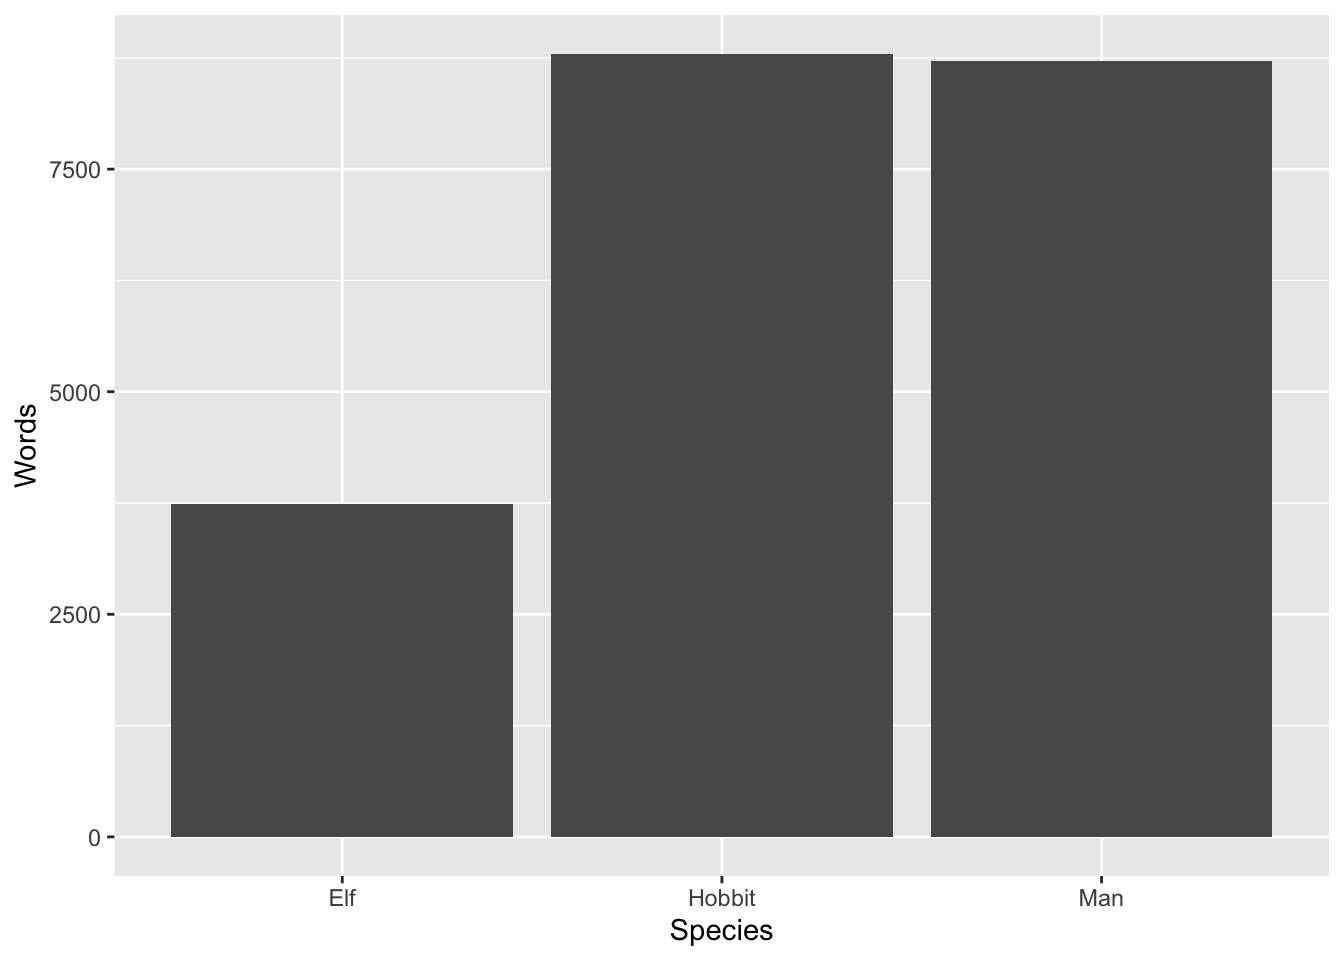
How about species? Does the dominant species differ on average (don’t differentiate between the three movies here)? (Hint: Proceed just as for Gender in the beginning: make a new summary data frame for which you group by Species and then count sum the words.)
ggplot(summary_data, aes(x = Species, y = Words)) +geom_col()
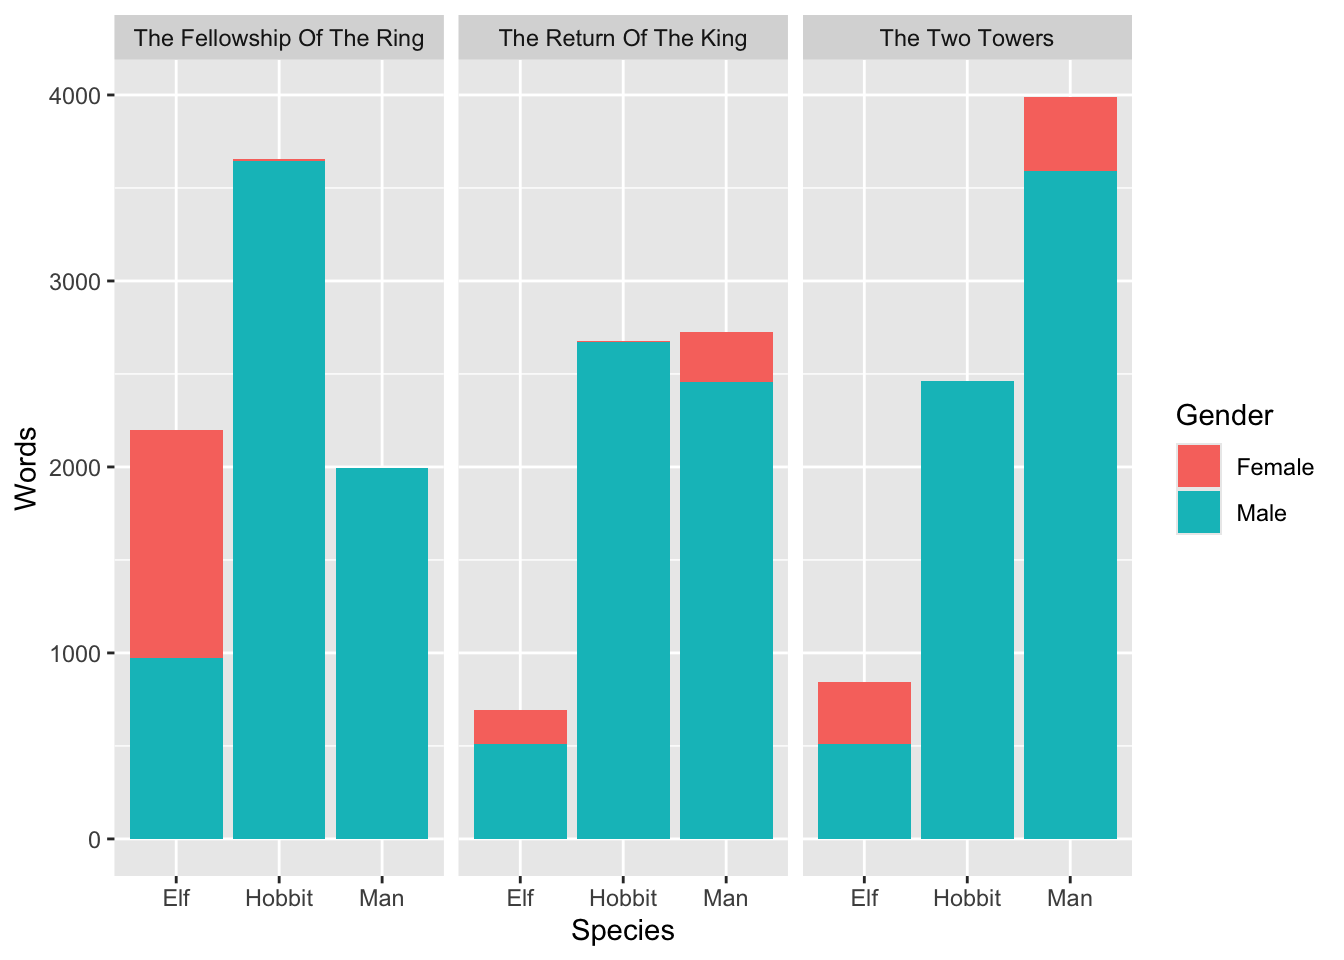
Create a plot that visualizes the number of words spoken by species, gender, and film simultaneously. Use the complete tidy lotr data frame. You don’t need to create a new summarized dataset (with group_by(Species, Gender, Film)) because the original data already has a row for each of those (you could make a summarized dataset, but it would be identical to the full version).
You need to show Species, Gender, and Film at the same time, but you only have two possible aesthetics (x and fill), so you’ll also need to facet by the third. Play around with different combinations (e.g. try x = Species, then x = Film) until you find one that tells the clearest story. For fun, add a labs() layer to add a title and subtitle and caption.
ggplot(lotr, aes(x = Species, y = Words, fill = Gender)) +geom_col() +facet_wrap(vars(Film))