| Survey Question | Answer Options | Variable Name | Variable Type |
|---|---|---|---|
| How far do you live from the Jourdan University building? | |||
| How do you get there, usually? | |||
| How much time approximately does it take you to get there? | |||
| What arrondissement/suburb do you live in? | |||
| Compared to your classmates, how close do you think you live to University? | |||
| What’s the most annoying part of your itinerary to/from university? | |||
| Please indicate your level of (dis)agreement with the following statement: 'My itinerary to university is annoying.' |
Variables, Distributions and Summary Statistics
Today we learn how to describe data
- Variables
- Distributions
- Definition
- Graphical representation
- Common distributions
- Central tendency
- Mean
- Median
- Spread
- Range, quantiles, and the IQR
- Variance and standard deviation
A variable is …
Some measure that can vary.

Variables
Imagine you fill out a survey about your way to school.
Variables
Variables
| Survey Question | Answer Options | Variable Name | Variable Type |
|---|---|---|---|
| How far do you live from the Jourdan University building? | Use the exact distance in km | ||
| How do you get there, usually? | Bike, Metro, Walking, or Other | ||
| How much time approximately does it take you to get there? | less than 15 mins, between 15 and 60 mins, more than 60 mins | ||
| What arrondissement/suburb do you live in? | Open-ended | ||
| Compared to your classmates, how close do you think you live to University? | Closer, About the same, Further away | ||
| What’s the most annoying part of your itinerary to/from university? | Describe briefly | ||
| Please indicate your level of (dis)agreement with the following statement: 'My itinerary to university is annoying.' | 1: Fully disagree – 5: Fully agree |
Variables
| Survey Question | Answer Options | Variable Name | Variable Type |
|---|---|---|---|
| How far do you live from the Jourdan University building? | Use the exact distance in km | Distance to school | |
| How do you get there, usually? | Bike, Metro, Walking, or Other | Mode of transportation | |
| How much time approximately does it take you to get there? | less than 15 mins, between 15 and 60 mins, more than 60 mins | Travel time | |
| What arrondissement/suburb do you live in? | Open-ended | Place of residence | |
| Compared to your classmates, how close do you think you live to University? | Closer, About the same, Further away | Relative perceived distance | |
| What’s the most annoying part of your itinerary to/from university? | Describe briefly | Object of annoyance | |
| Please indicate your level of (dis)agreement with the following statement: 'My itinerary to university is annoying.' | 1: Fully disagree – 5: Fully agree | Degree of annoyance |
Variables
| Survey Question | Answer Options | Variable Name | Variable Type |
|---|---|---|---|
| How far do you live from the Jourdan University building? | Use the exact distance in km | Distance to school | Numeric |
| How do you get there, usually? | Bike, Metro, Walking, or Other | Mode of transportation | Nominal |
| How much time approximately does it take you to get there? | less than 15 mins, between 15 and 60 mins, more than 60 mins | Travel time | Ordinal |
| What arrondissement/suburb do you live in? | Open-ended | Place of residence | Nominal |
| Compared to your classmates, how close do you think you live to University? | Closer, About the same, Further away | Relative perceived distance | Ordinal |
| What’s the most annoying part of your itinerary to/from university? | Describe briefly | Object of annoyance | Open-ended |
| Please indicate your level of (dis)agreement with the following statement: 'My itinerary to university is annoying.' | 1: Fully disagree – 5: Fully agree | Degree of annoyance | Ordinal/Numeric/Discrete |
Overview Variable Types
| Variable Type | Description | Example |
|---|---|---|
| Nominal | The color of a flower is another example of a nominal variable. Is the flower white, orange, or red? None of those options is “more” than the others; they’re just different. | Flower color (White, Orange, Red) |
| Ordinal | An ordinal variable, just like nominal variables, has categories. But some values are clearly “more” and others clearly “less” - you can ‘order’ observations. However, it is not clear how much more or less one value is than another, and differences might not always be the same between one value and the next. | Satisfaction levels (Low, Medium, High) |
| Continuous | A continuous variable can take any numeric value within a given range. | A person's height (e.g., 170.5 cm) |
| Discrete | A discrete variable is numeric, but can only take specific, distinct values. For example, the score given by a judge to a gymnast (only integer values between 0 and 10). | A judge's score in a gymnast competition (only integer values between 0 and 10) |
| Qualitative | Free text. To quantify it, people typically try to cateogrize them. | Open-ended survey answers (e.g. 'Describe your day in detail') or a data frame with news paper headlines |
Distributions
Distributions
The point of descriptive statistics is to summarize a big table of values with a small set of tractable statistics
The most comprehensive way to characterize a variable/vector is to compute its distribution:
- What are the values the variable takes?
- How frequently does each of these values appear?
Distributions
Consider this variable
   V1
1   3
2   5
3   4
4   6
5   5
6   4
7   5
8   7
9   7
10  6
11  1
12  7
13  6
14  7
15  6
16  4
17  7
18  7
19  6
20  6
21  5
22  6
23  6
24  3
25  4
26  5
27  2
28  6
29  8
30  8
We can count how many times each value appears
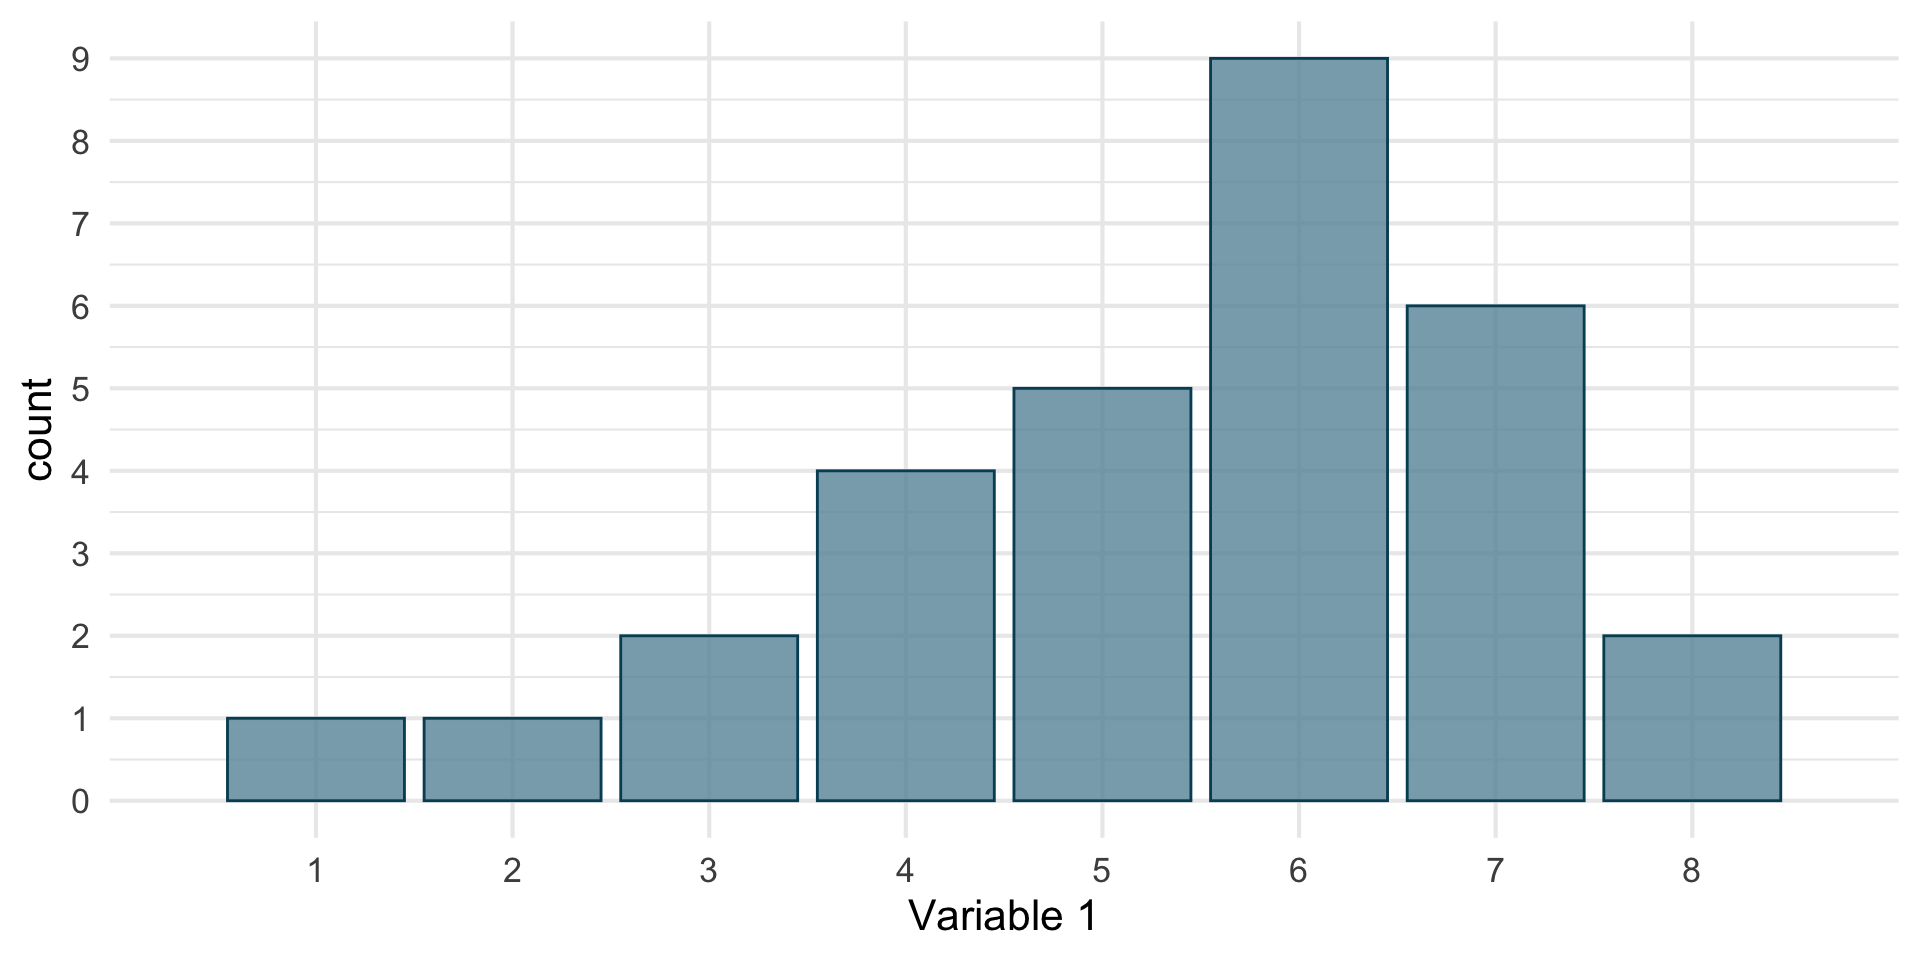
# A tibble: 8 × 2
     V1     n
  <int> <int>
1     1     1
2     2     1
3     3     2
4     4     4
5     5     5
6     6     9
7     7     6
8     8     2
Voilà the distribution of our variable.
Distributions
We can represent this distribution graphically with a bar plot.
- Each possible value on the x-axis
- Their number of occurrences on the y-axis
Distributions
Would that also work for this variable?
V1
1 3
2 5
3 4
4 6
5 5
6 4
7 5
8 7
9 7
10 6
11 1
12 7
13 6
14 7
15 6
16 4
17 7
18 7
19 6
20 6
21 5
22 6
23 6
24 3
25 4
26 5
27 2
28 6
29 8
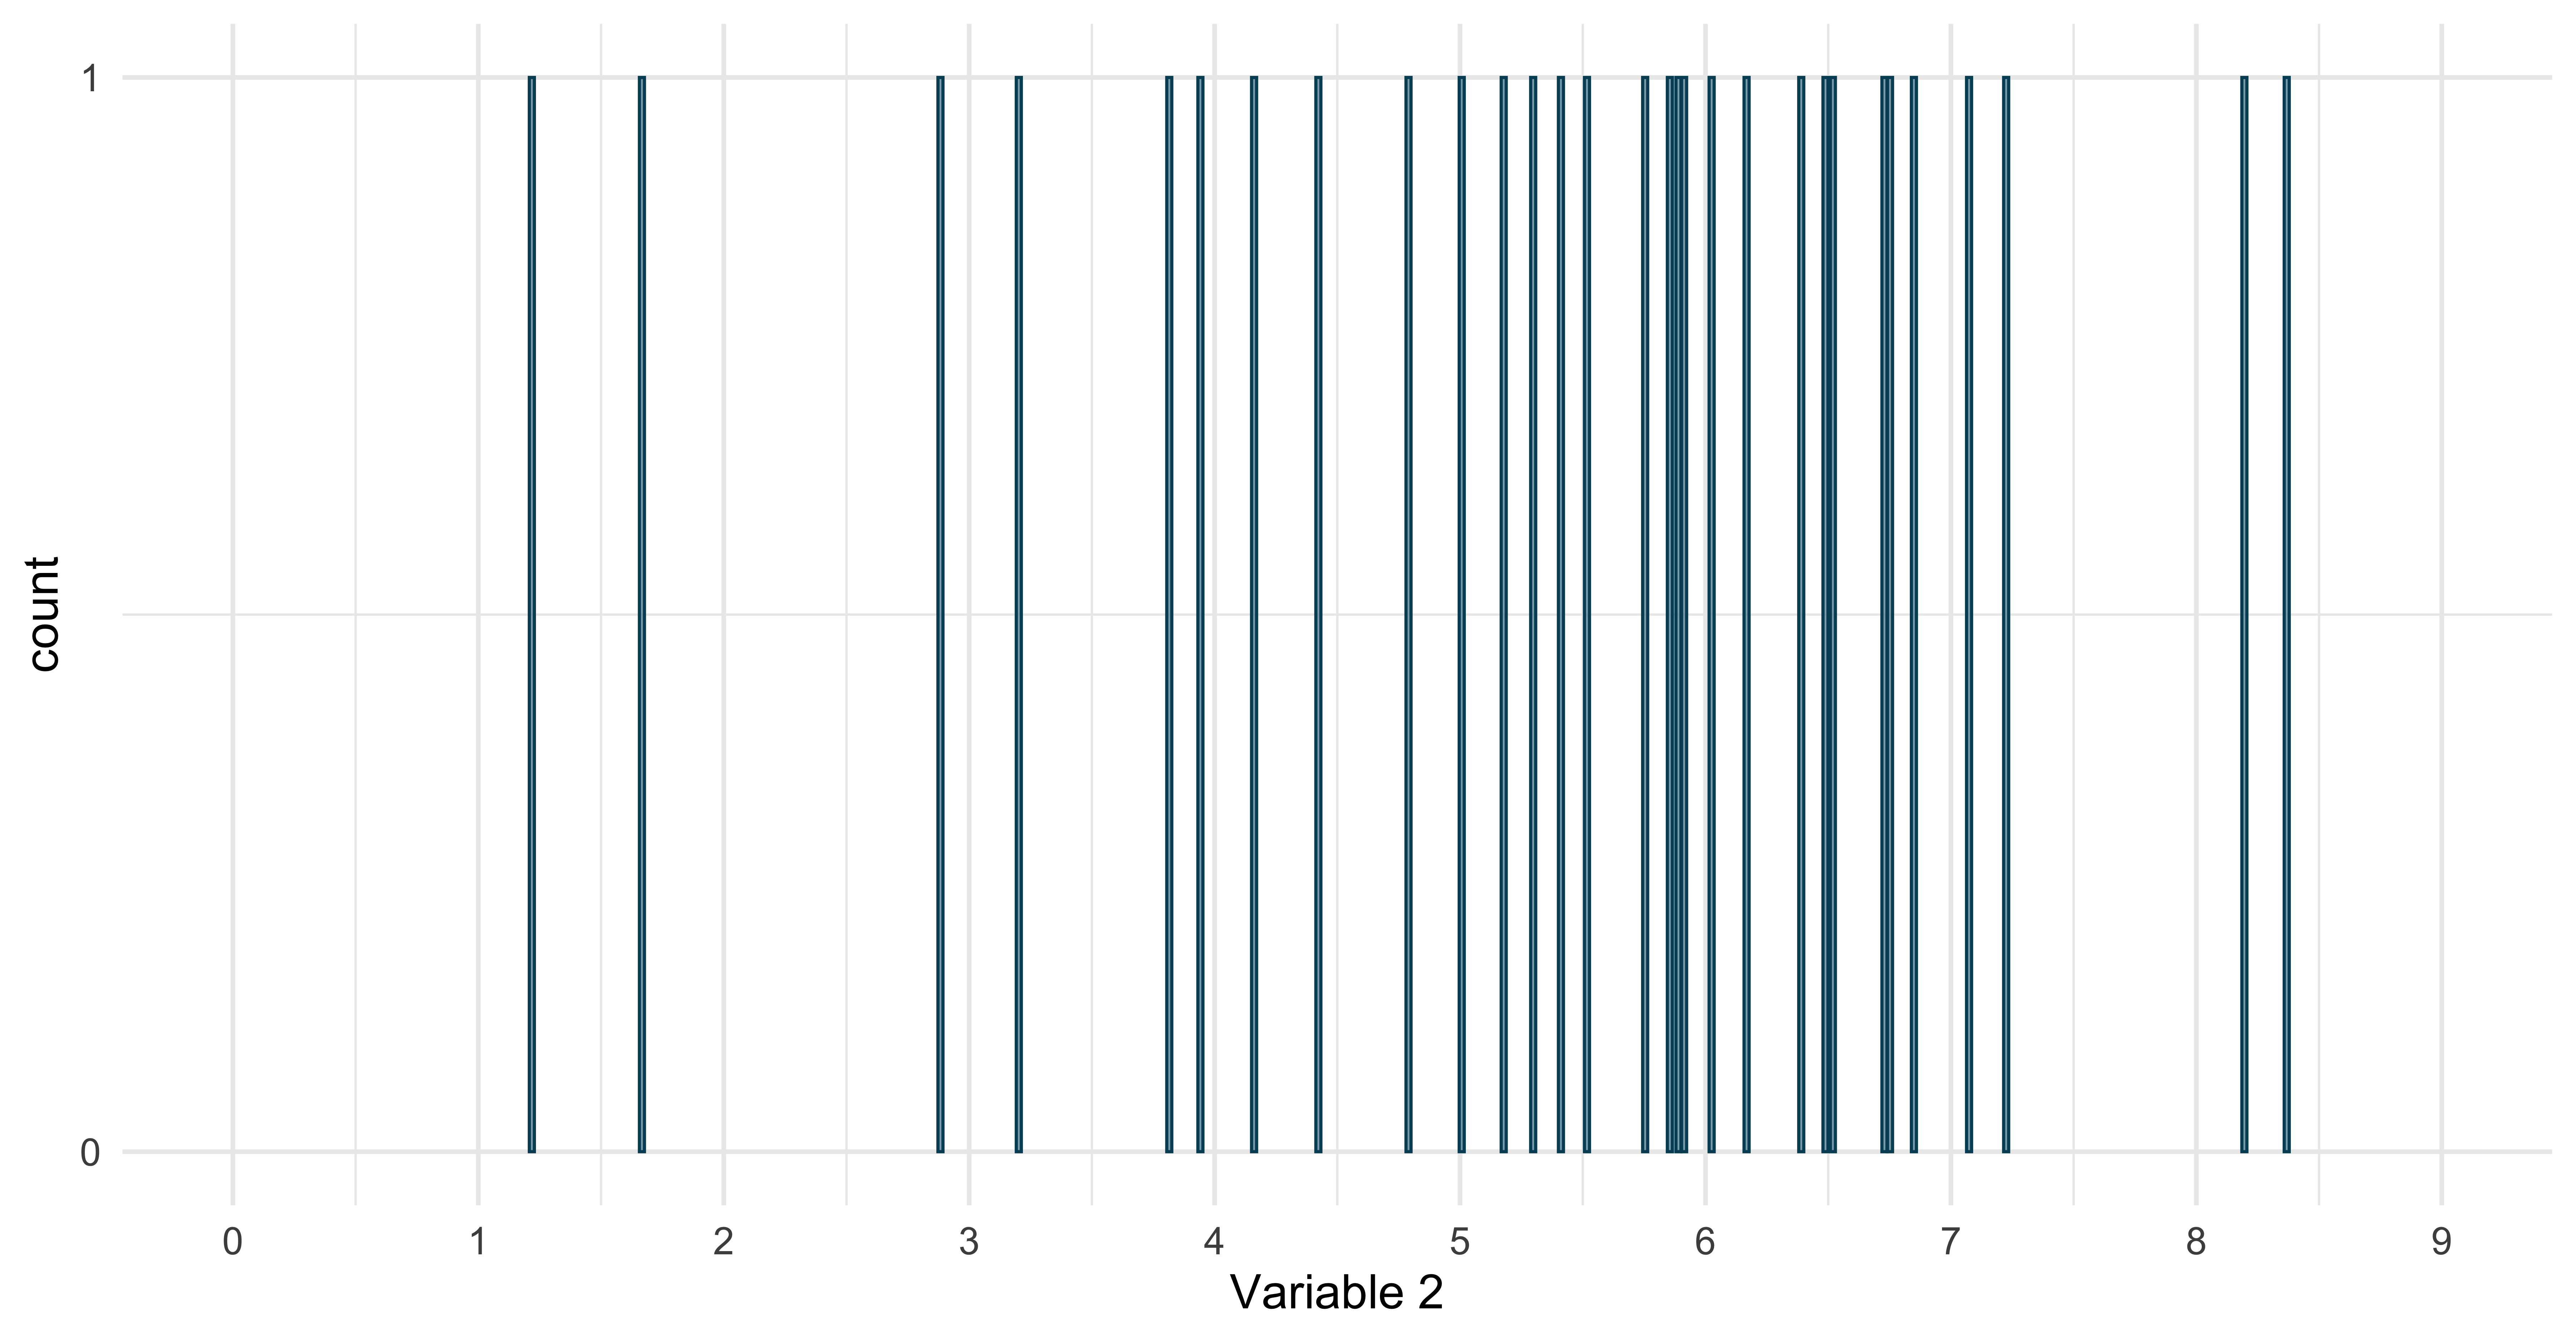
30 8No! In this case, each value appears only once.
Distributions
This is what the corresponding bar plot would look like
Distributions
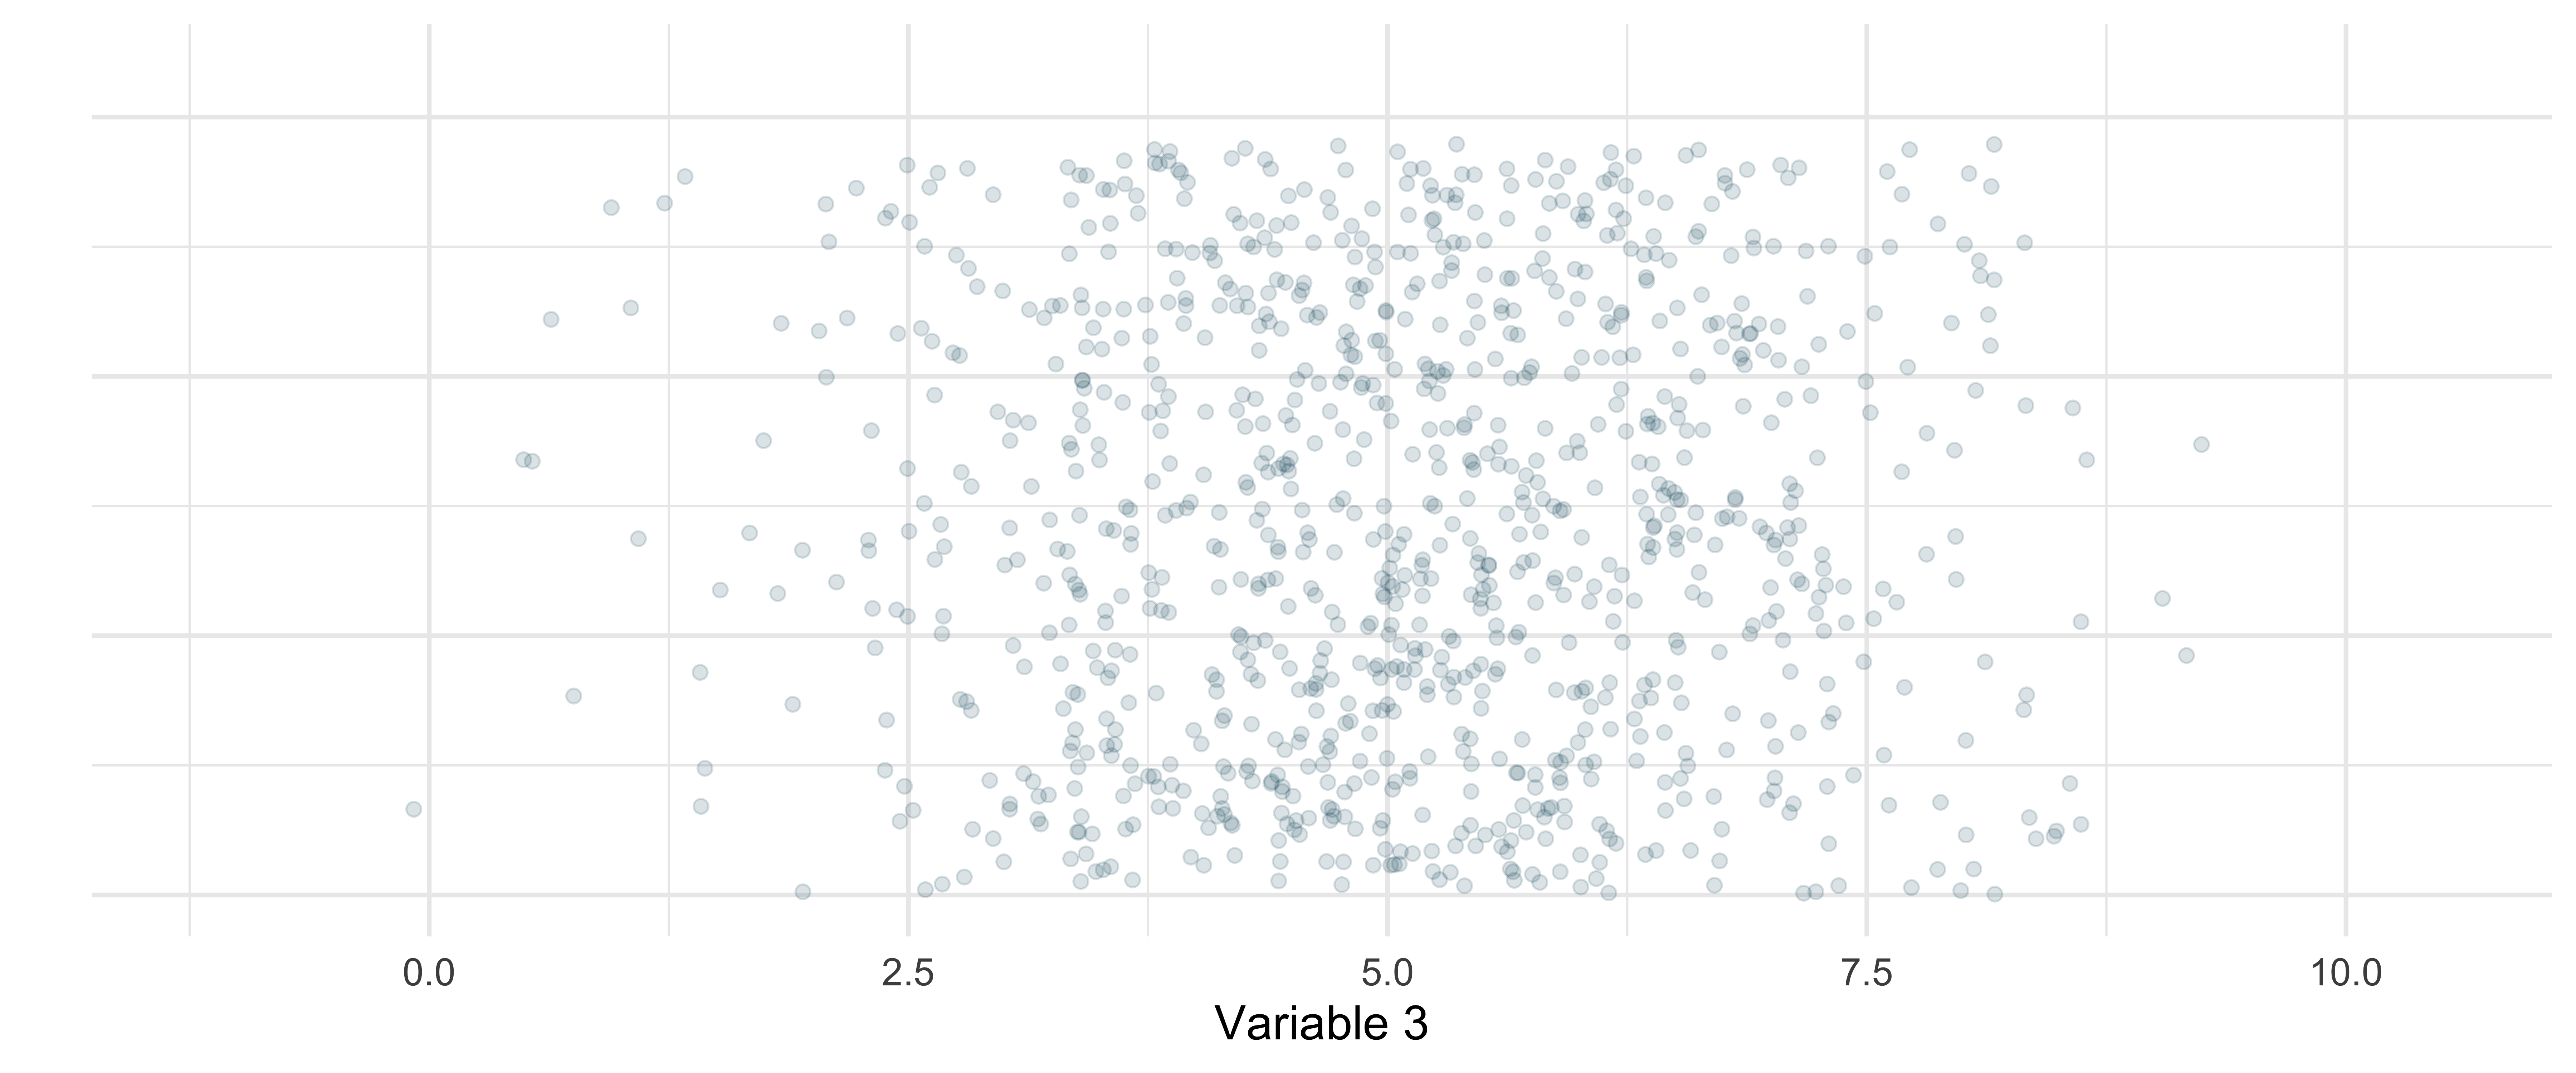
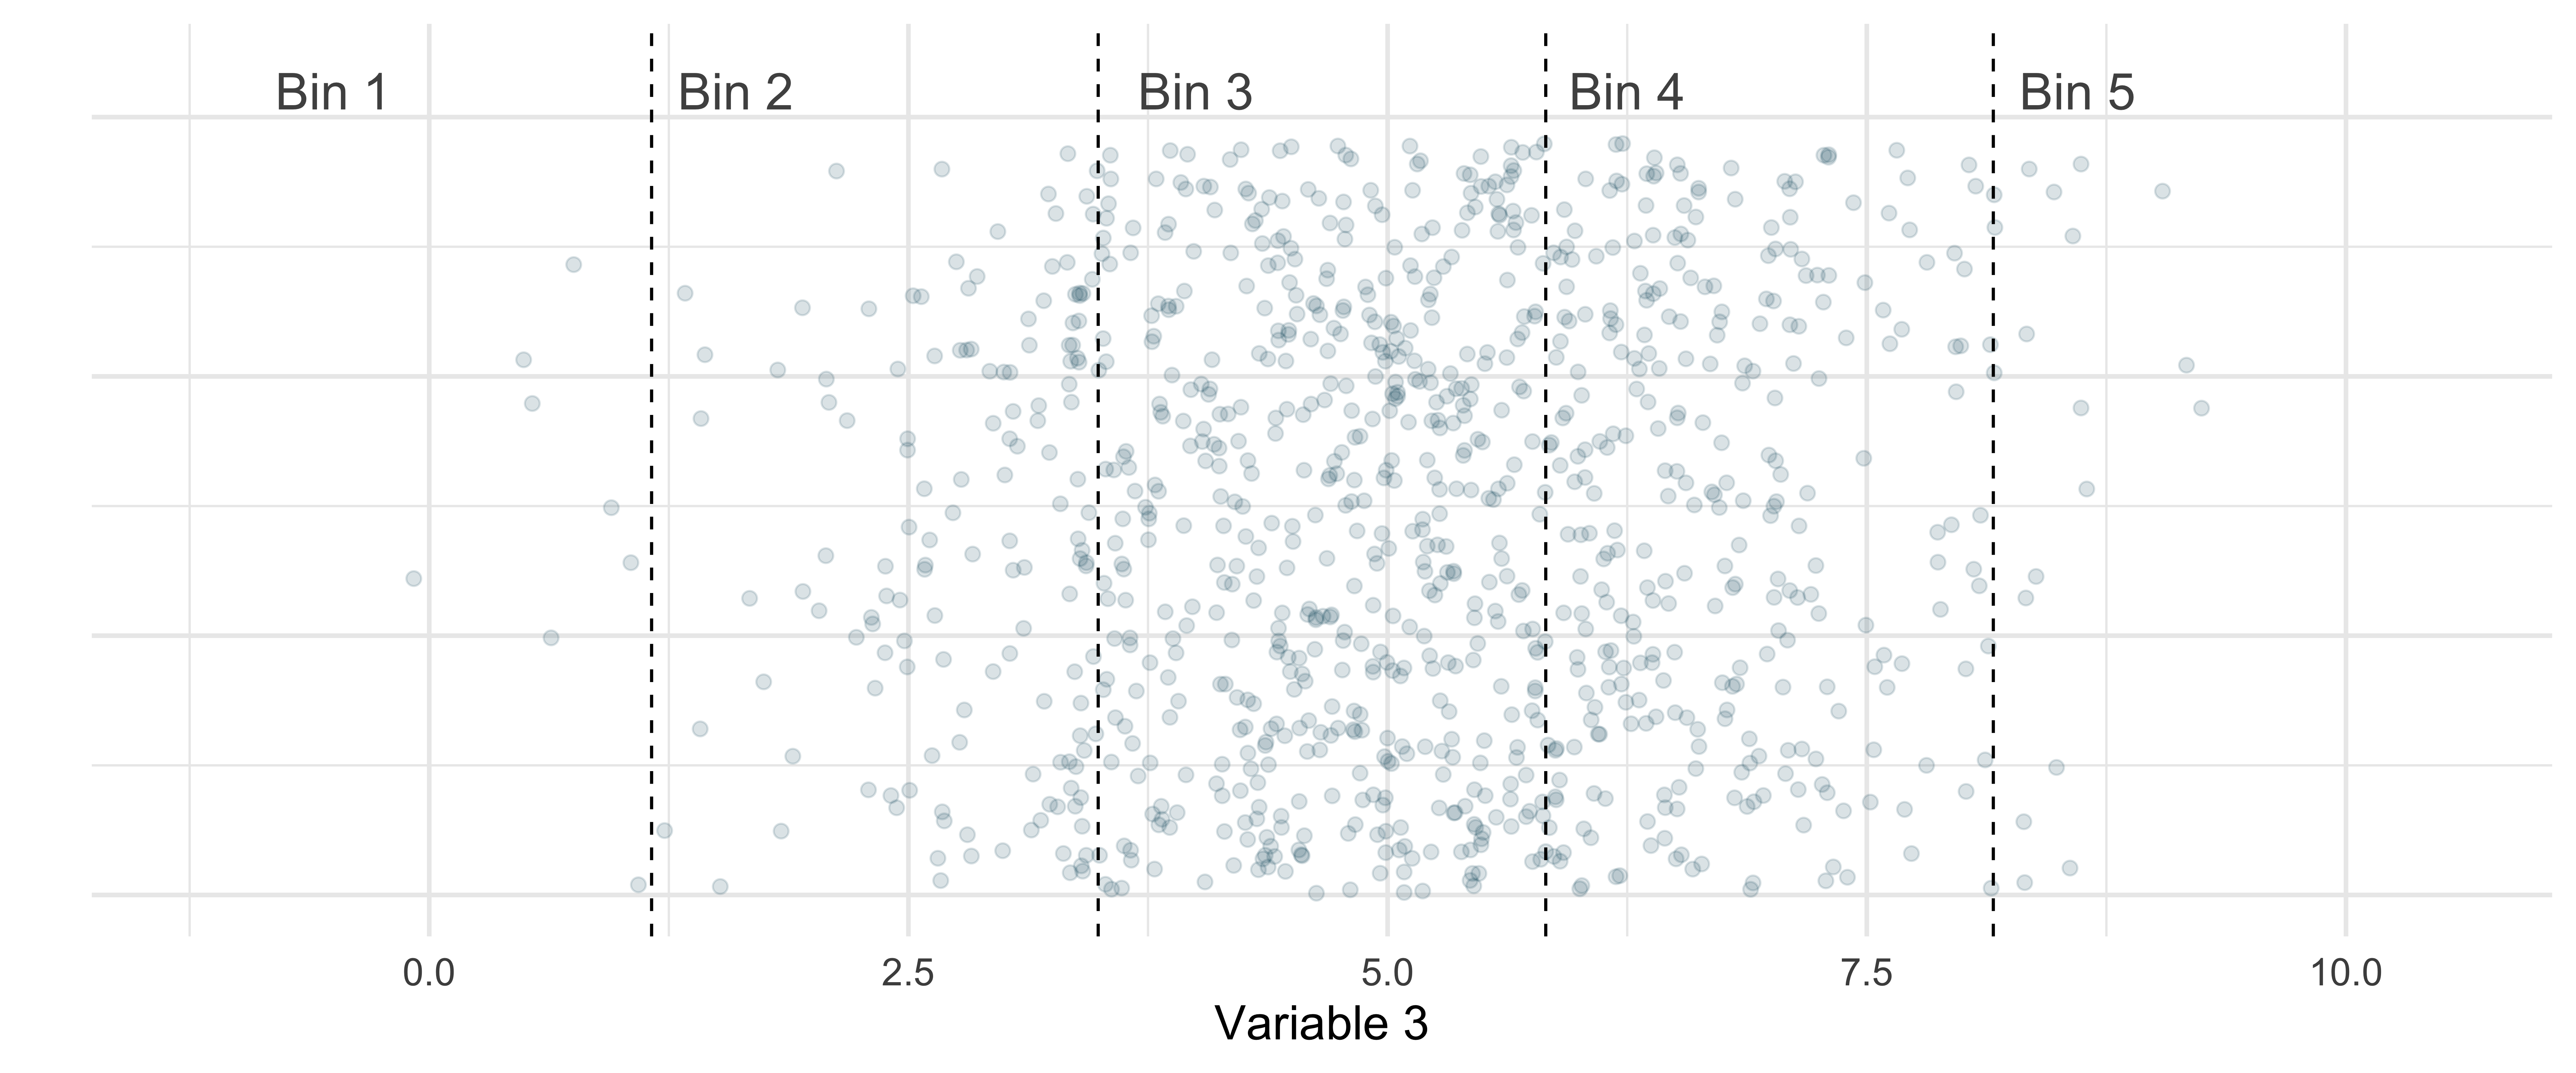
For continuous variables, one solution to get a sense of the distribution is to do a histogram.
Consider for instance the following variable. For clarity each point is shifted vertically by a random amount.
Distributions
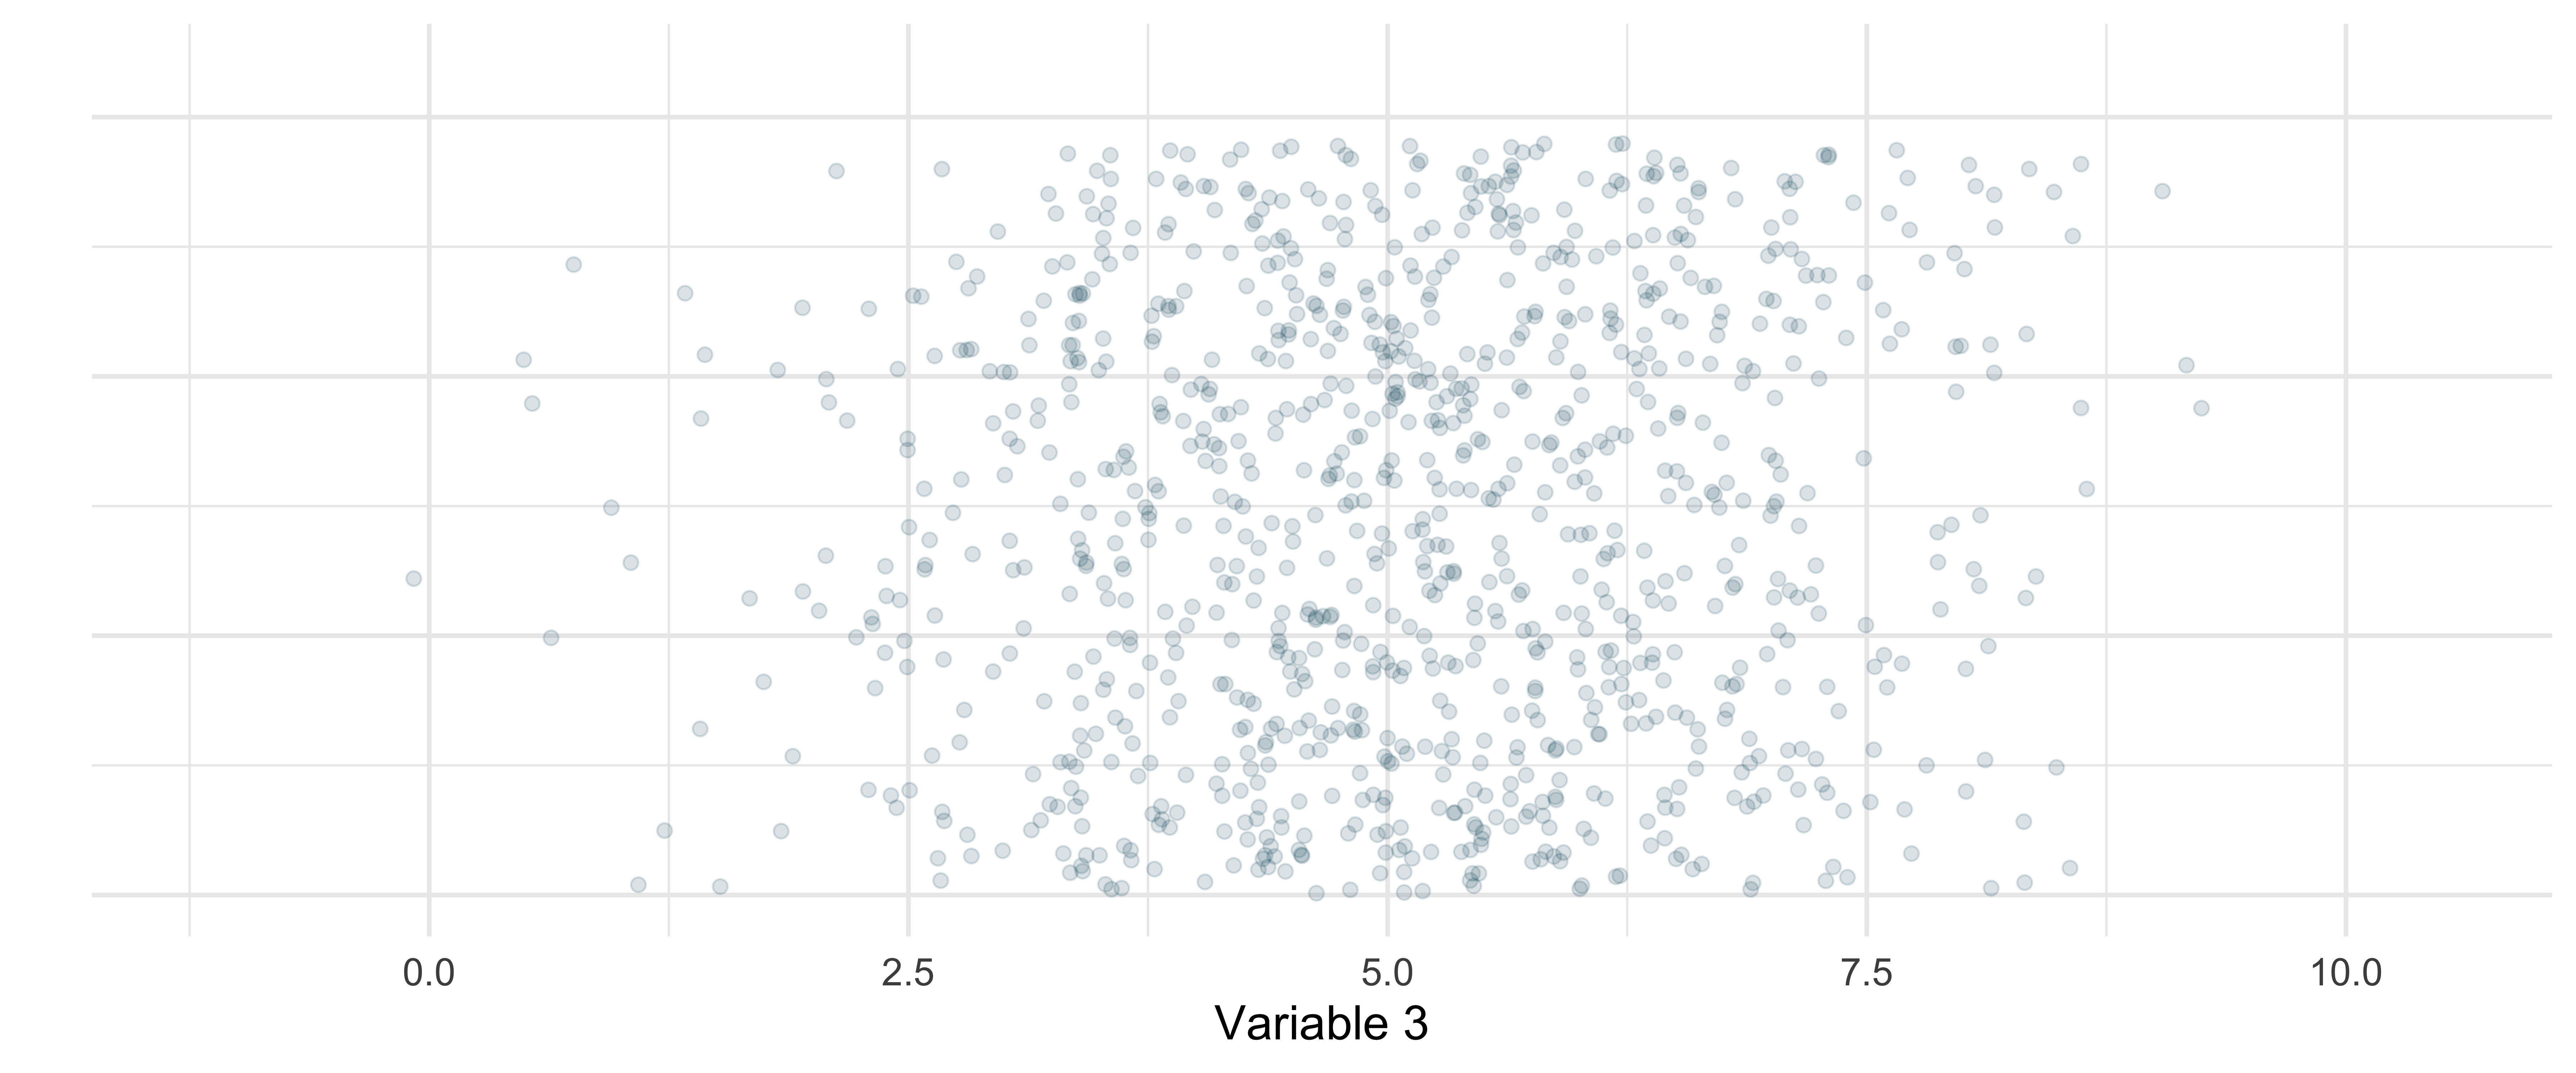
We can divide the domain of this variable into 5 bins
Distributions
We can divide the domain of this variable into 5 bins
Distributions
And count the number of observations within each bin
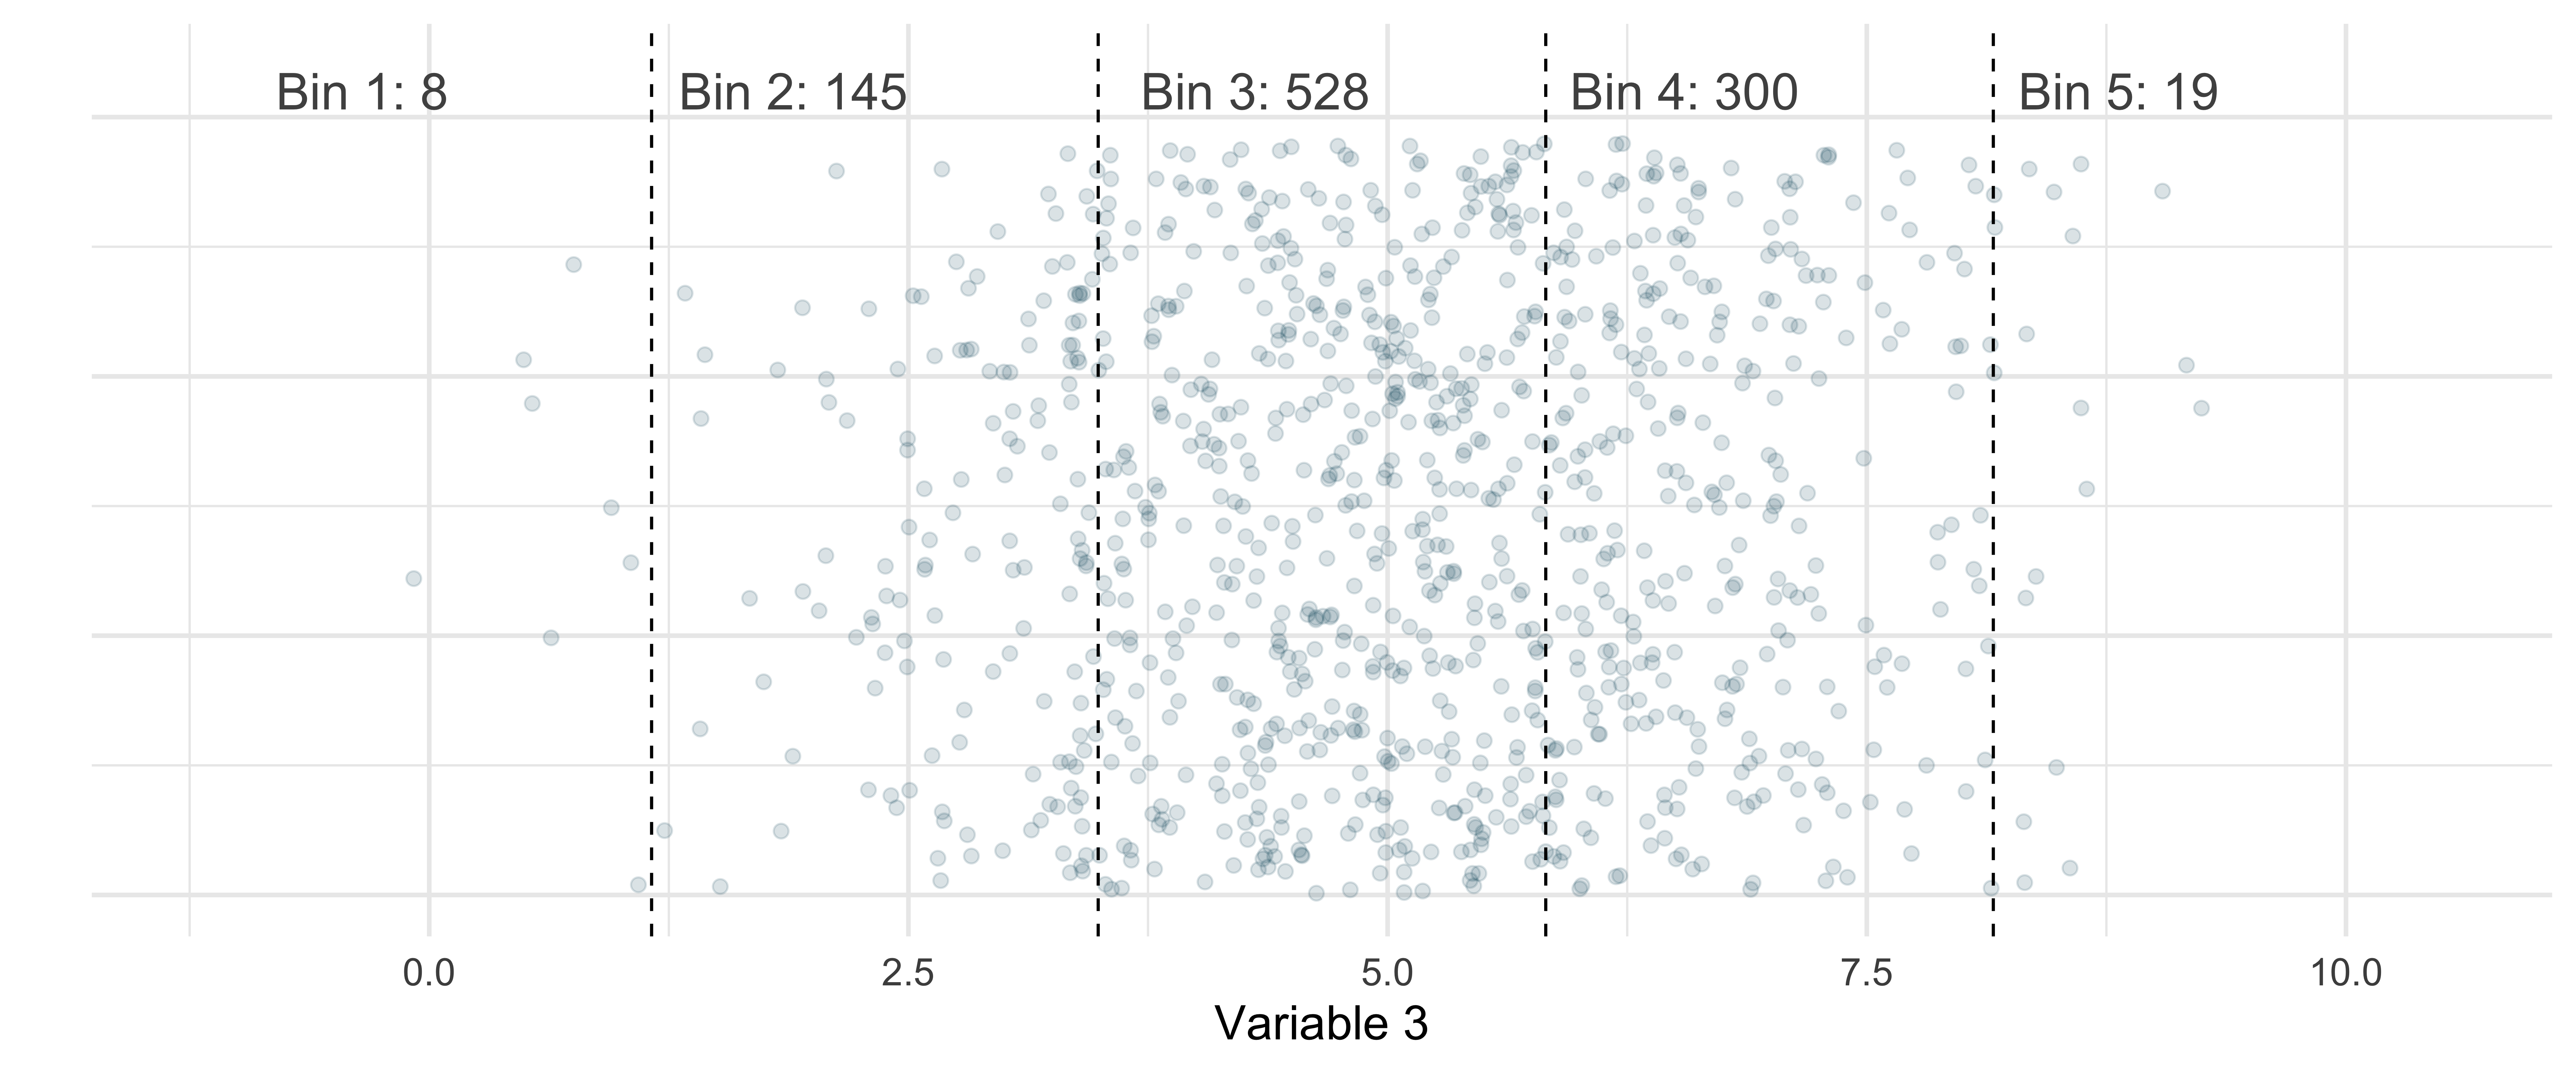
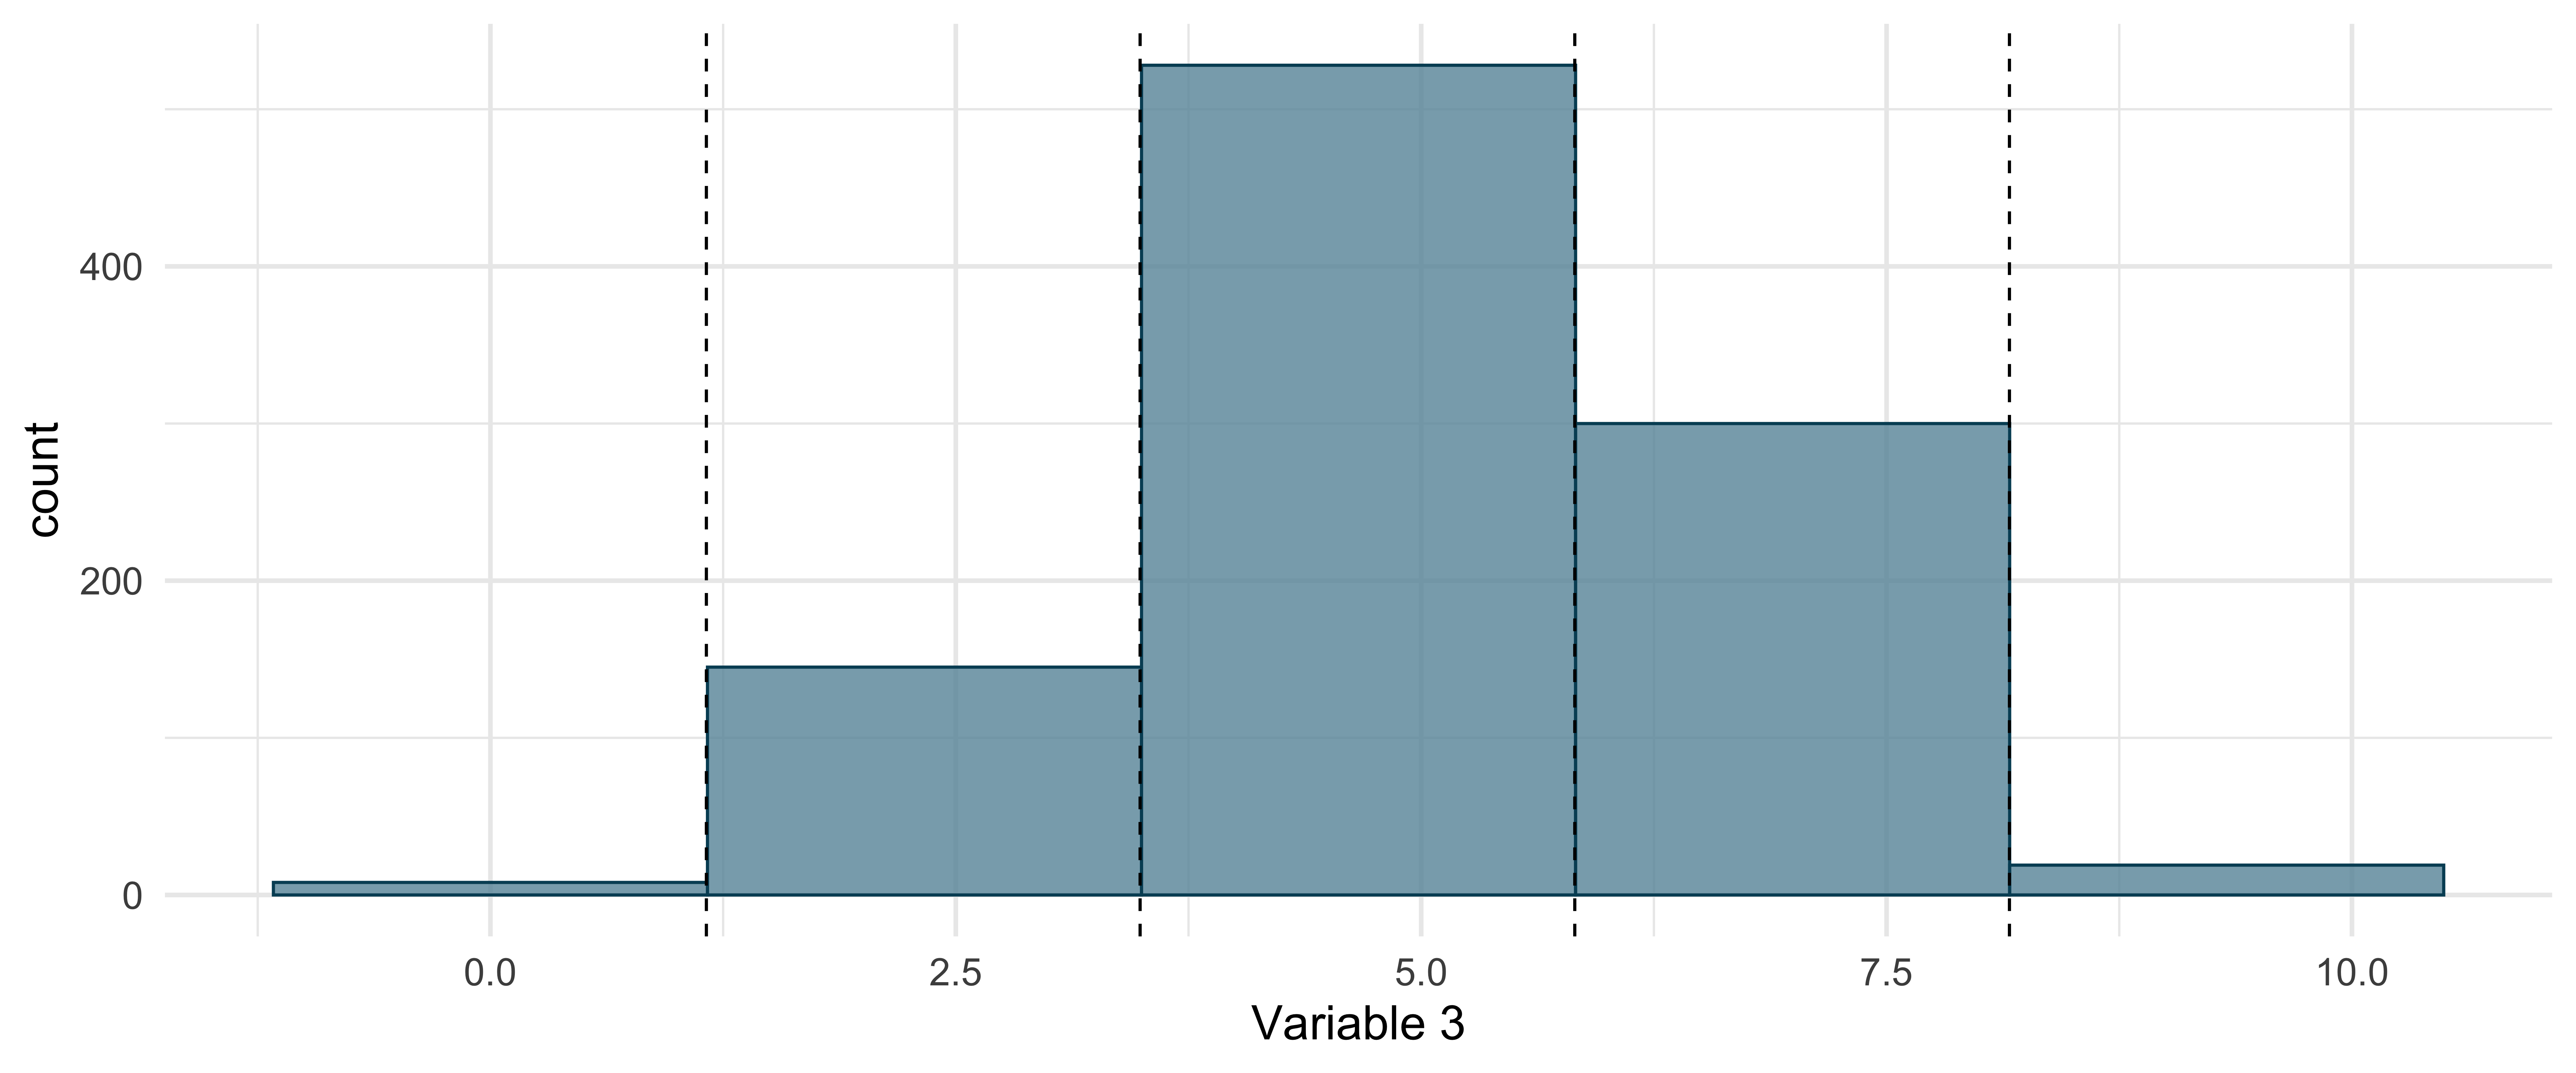
Distributions
If we plot the count per bin, we get a histogram
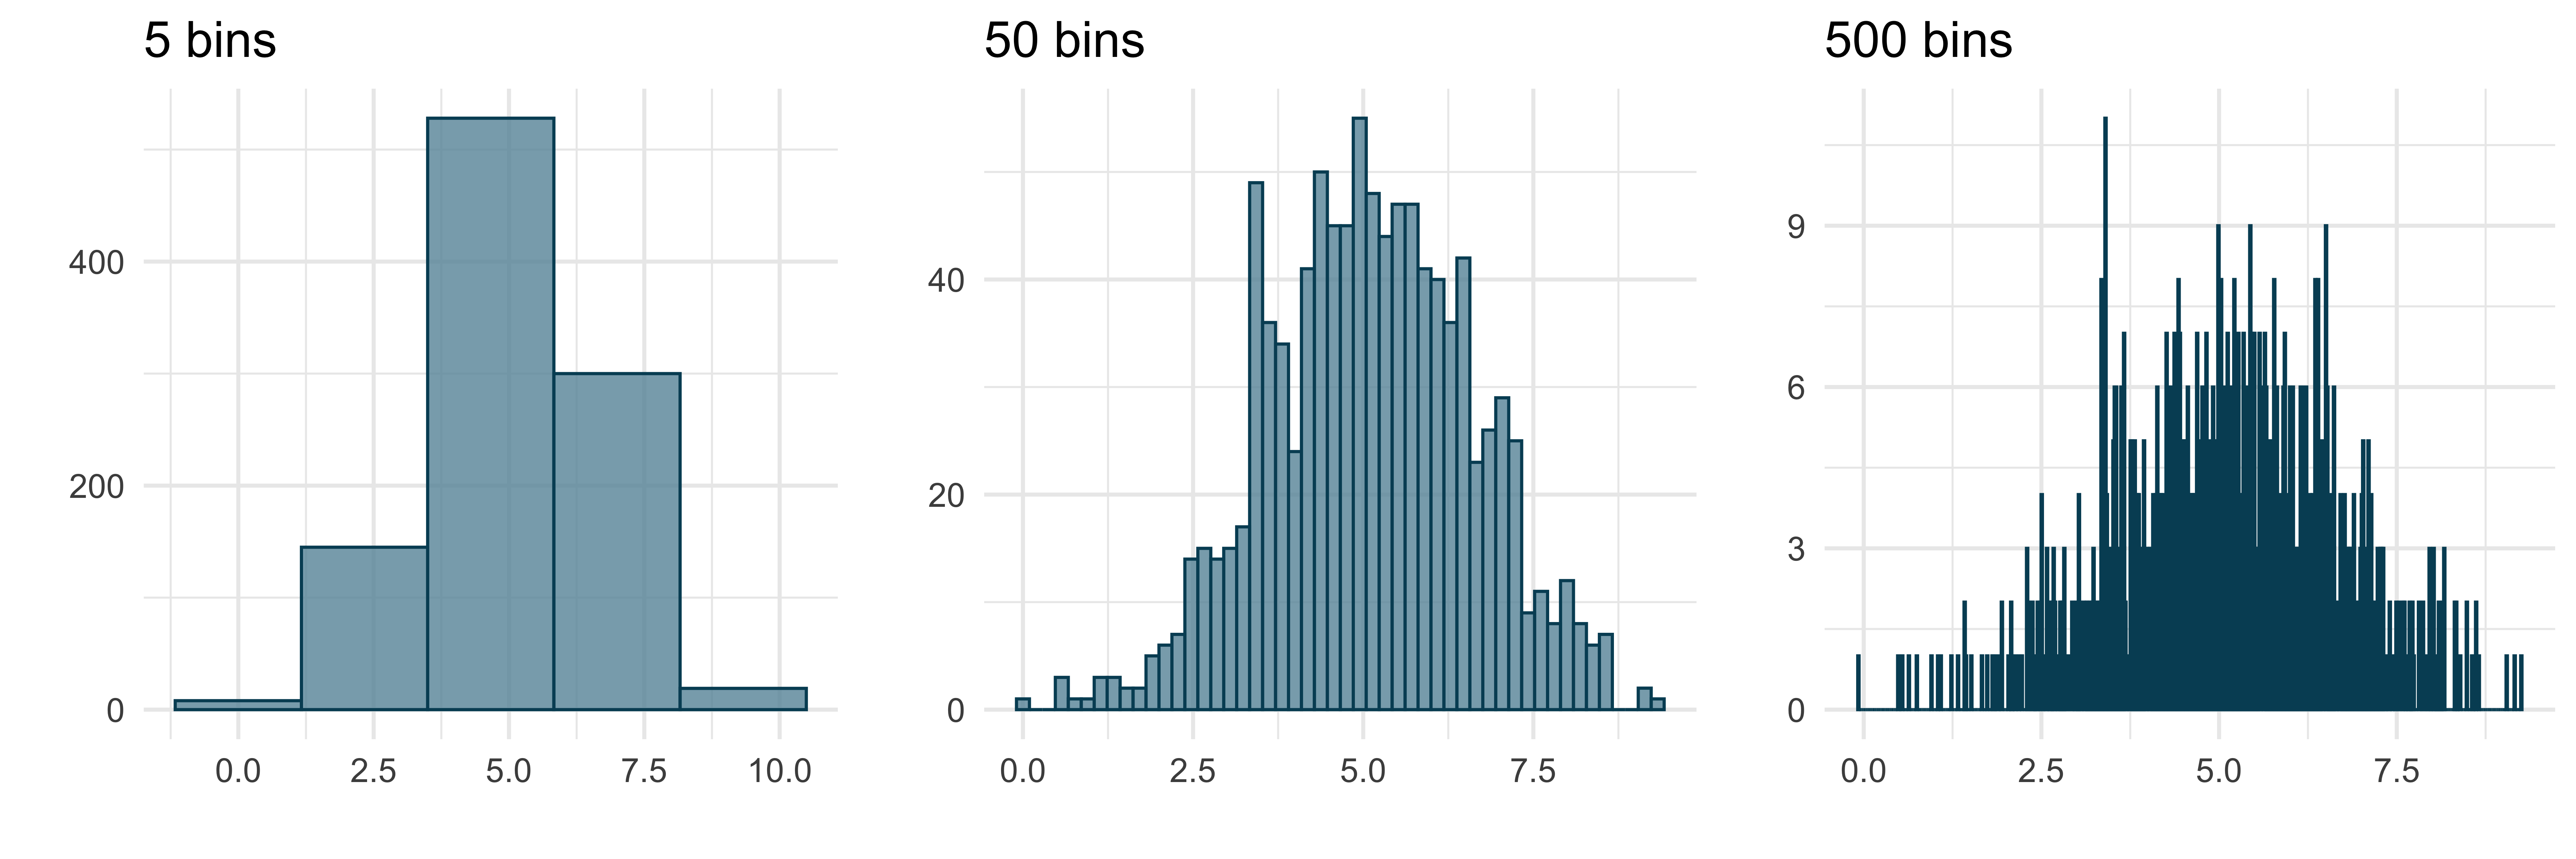
Distributions
There’s no definitive rule to choose the number of bins.
Too few can be misleading, too many can be impractical for visualizing.
Distributions
- Oftentimes, instead of histograms, density plots are used.
- Both are based on the same principle: grouping data points.
- But densities are continuous

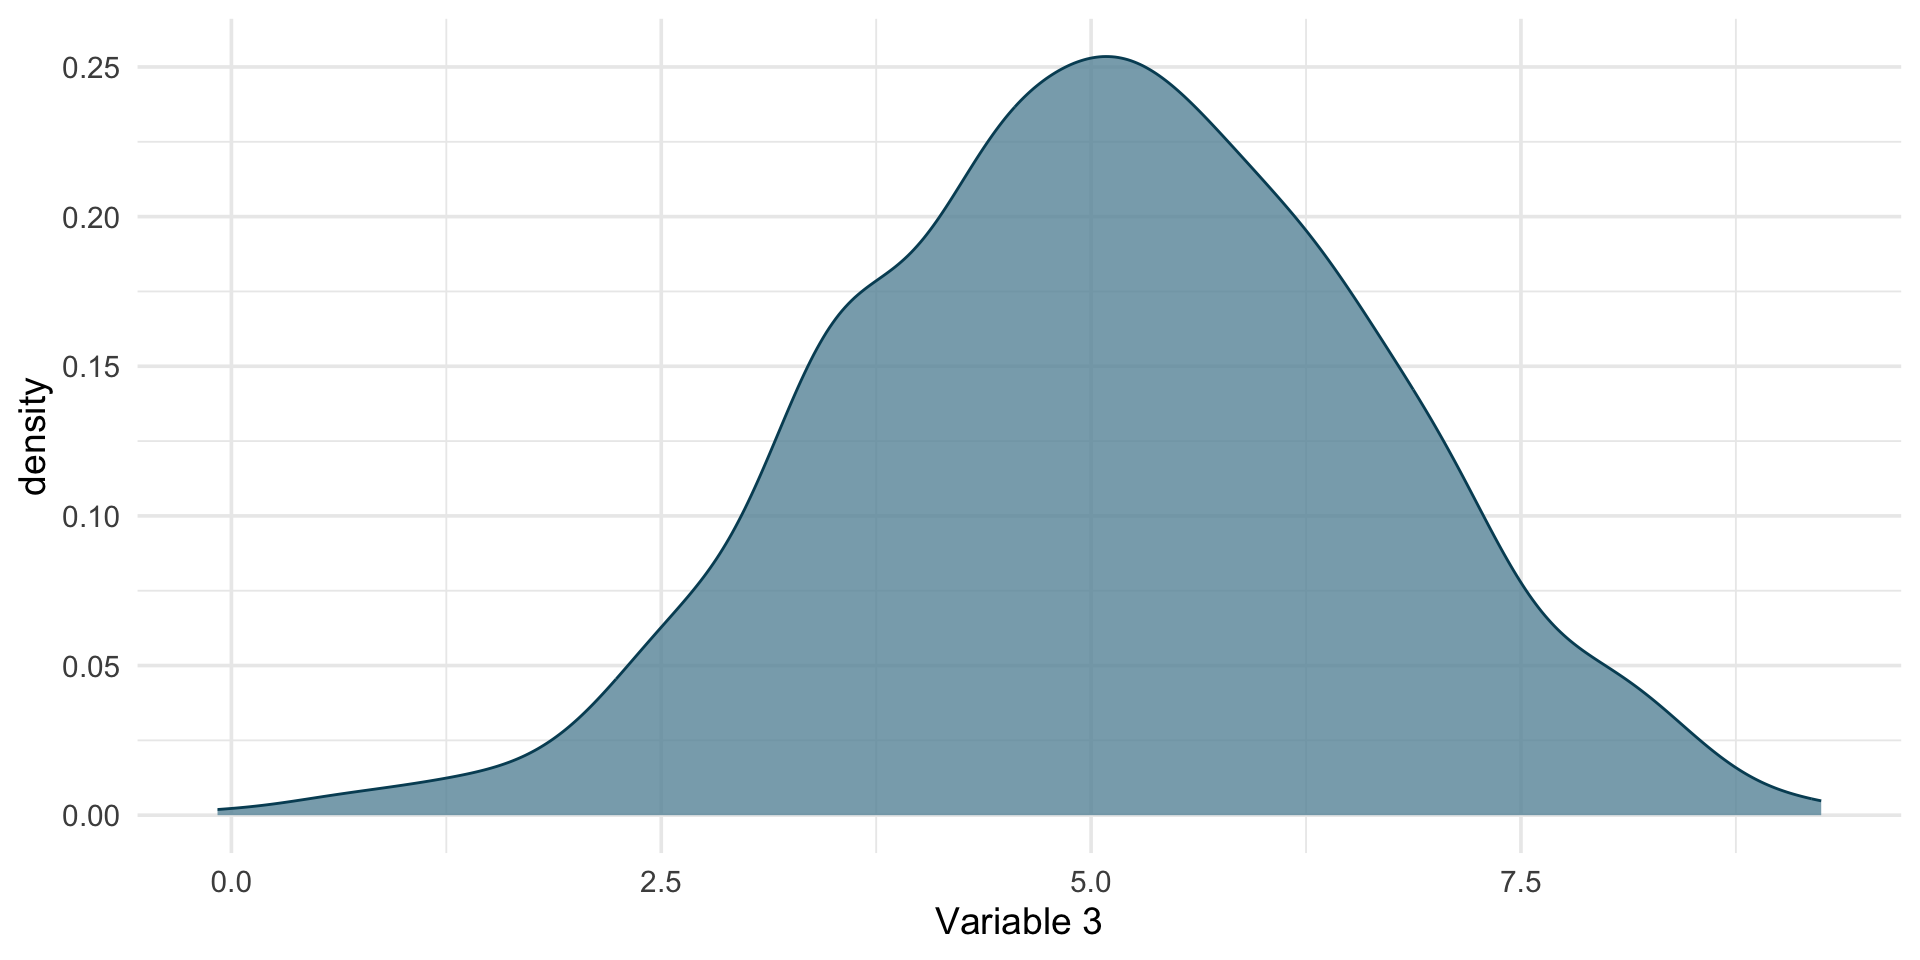
Distributions
You won’t learn how to derive densities in this course
All you need to know: The higher the value on the y-axis, the more observations there are around the corresponding x location
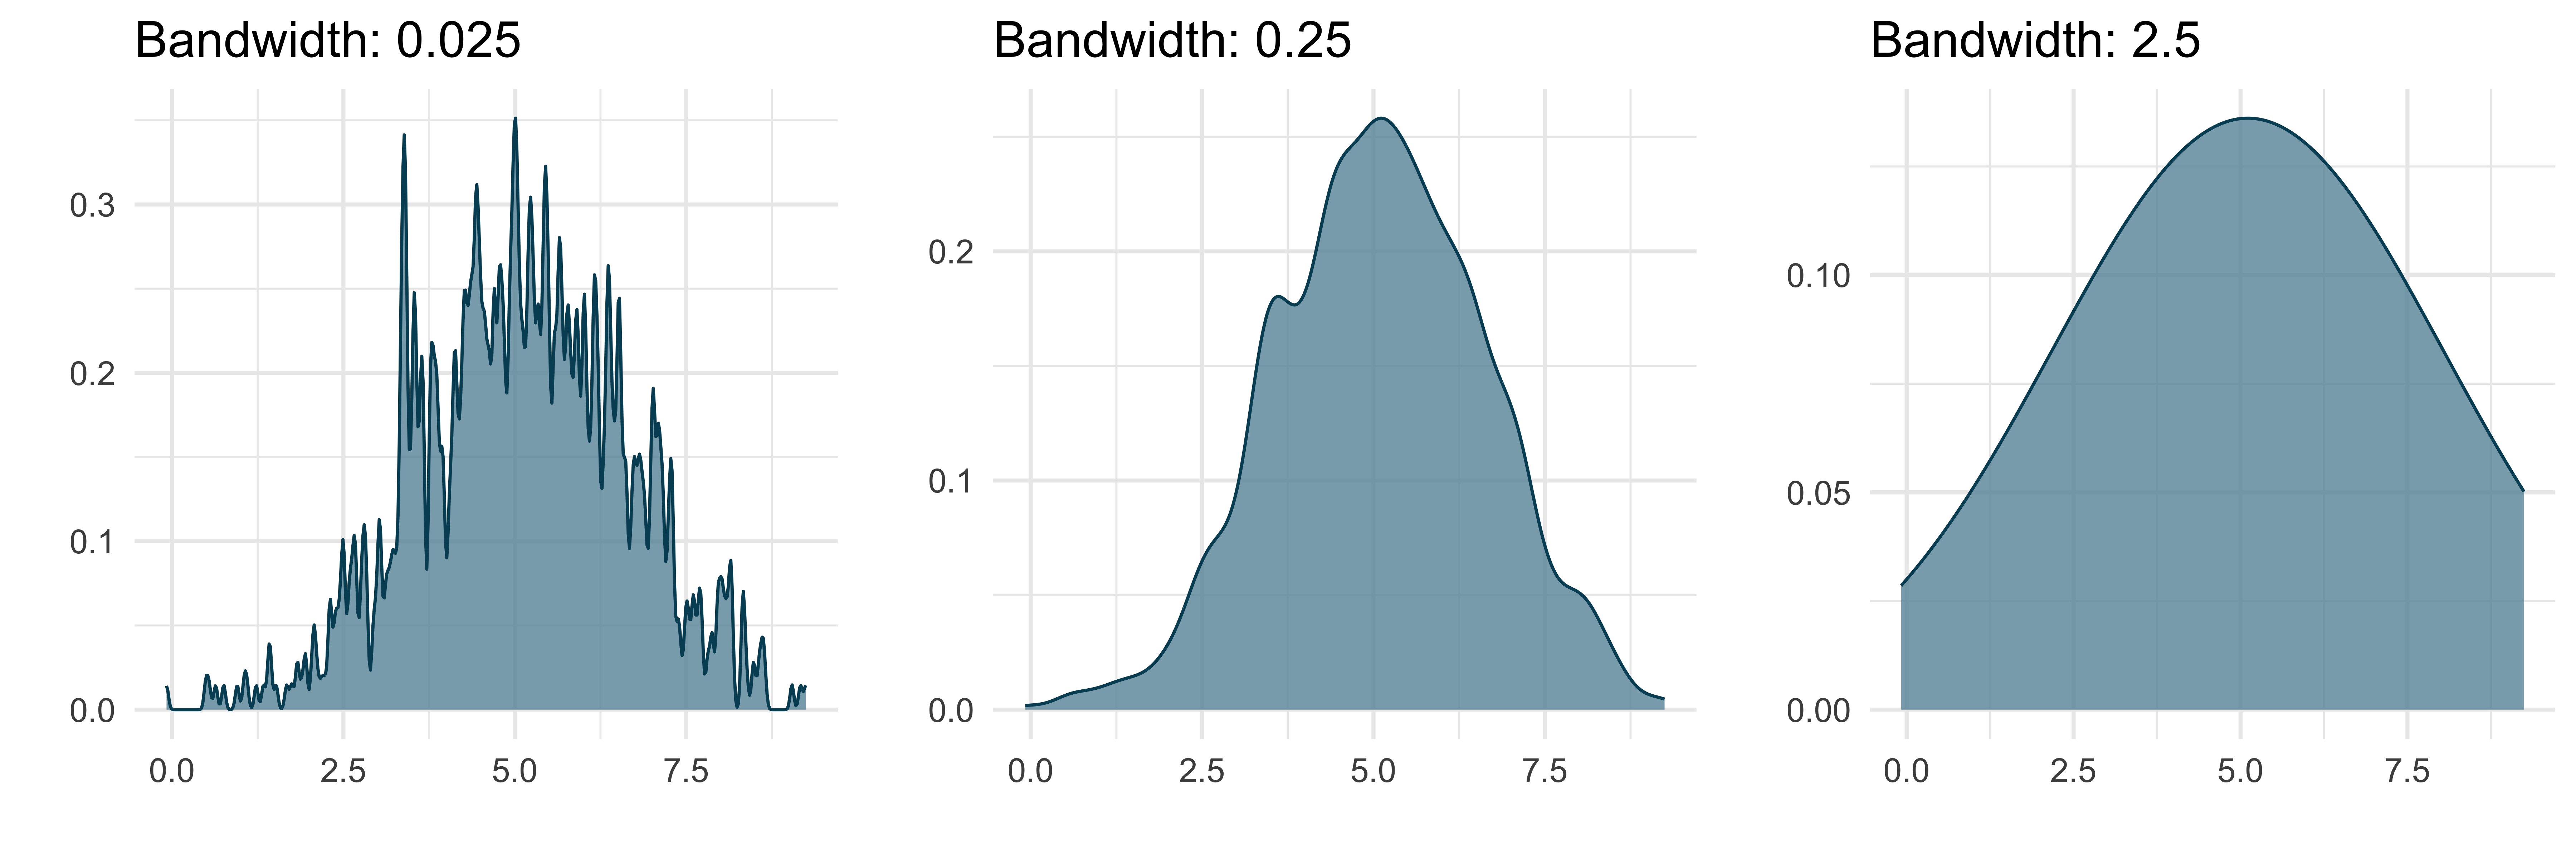
Like the histogram can have a varying number of bins, the density plot can vary in its bandwidth
How to summarize distributions with just a couple of numbers?
(you are probably impatient to hear the answer)
How to summarize distributions with just a couple of numbers?
- By describing their central tendency (e.g., mean, median)
- And their spread (e.g., standard deviation, inter-quartile range)
Central tendency
Mean
The mean is the most common statistic to describe central tendencies.
   V1
1   3
2   5
3   4
4   6
5   5
6   4
7   5
8   7
9   7
10  6
11  1
12  7
13  6
14  7
15  6
16  4
17  7
18  7
19  6
20  6
21  5
22  6
23  6
24  3
25  4
26  5
27  2
28  6
29  8
30 8Median
To obtain the median you first need to sort the values.
   V1
1   1
2   2
3   3
4   3
5   4
6   4
7   4
8   4
9   5
10  5
11  5
12  5
13  5
14  6
15  6
16  6
17  6
18  6
19  6
20  6
21  6
22  6
23  7
24  7
25  7
26  7
27  7
28  7
29  8
30  8
The median is the value that divides the distribution into two halves
When there is an even number of observations, the median is the average of the last value of the first half and the first value of the second half
\[\text{Med}(x) = \begin{cases} x[\frac{N+1}{2}] & \text{if } N \text{ is odd}\\ \frac{x[\frac{N}{2}]+x[\frac{N}{2}+1]}{2} & \text{if } N \text{ is even} \end{cases}\]
Here, since we have 30 observations, we take the average of the 15th and 16th value:
\[[\frac{6+6}{2}] = 6\]
Median
To obtain the median you first need to sort the values.
   V1
1   1
2   2
3   3
4   3
5   4
6   4
7   4
8   4
9   5
10  5
11  5
12  5
13  5
14  6
15  6
16  6
17  6
18  6
19  6
20  6
21  6
22  6
23  7
24  7
25  7
26  7
27  7
28  7
29  8
30 8Mean vs. Median
Which of these two measures of central tendency you use will vary on the context.
Mostly, it will be the mean.
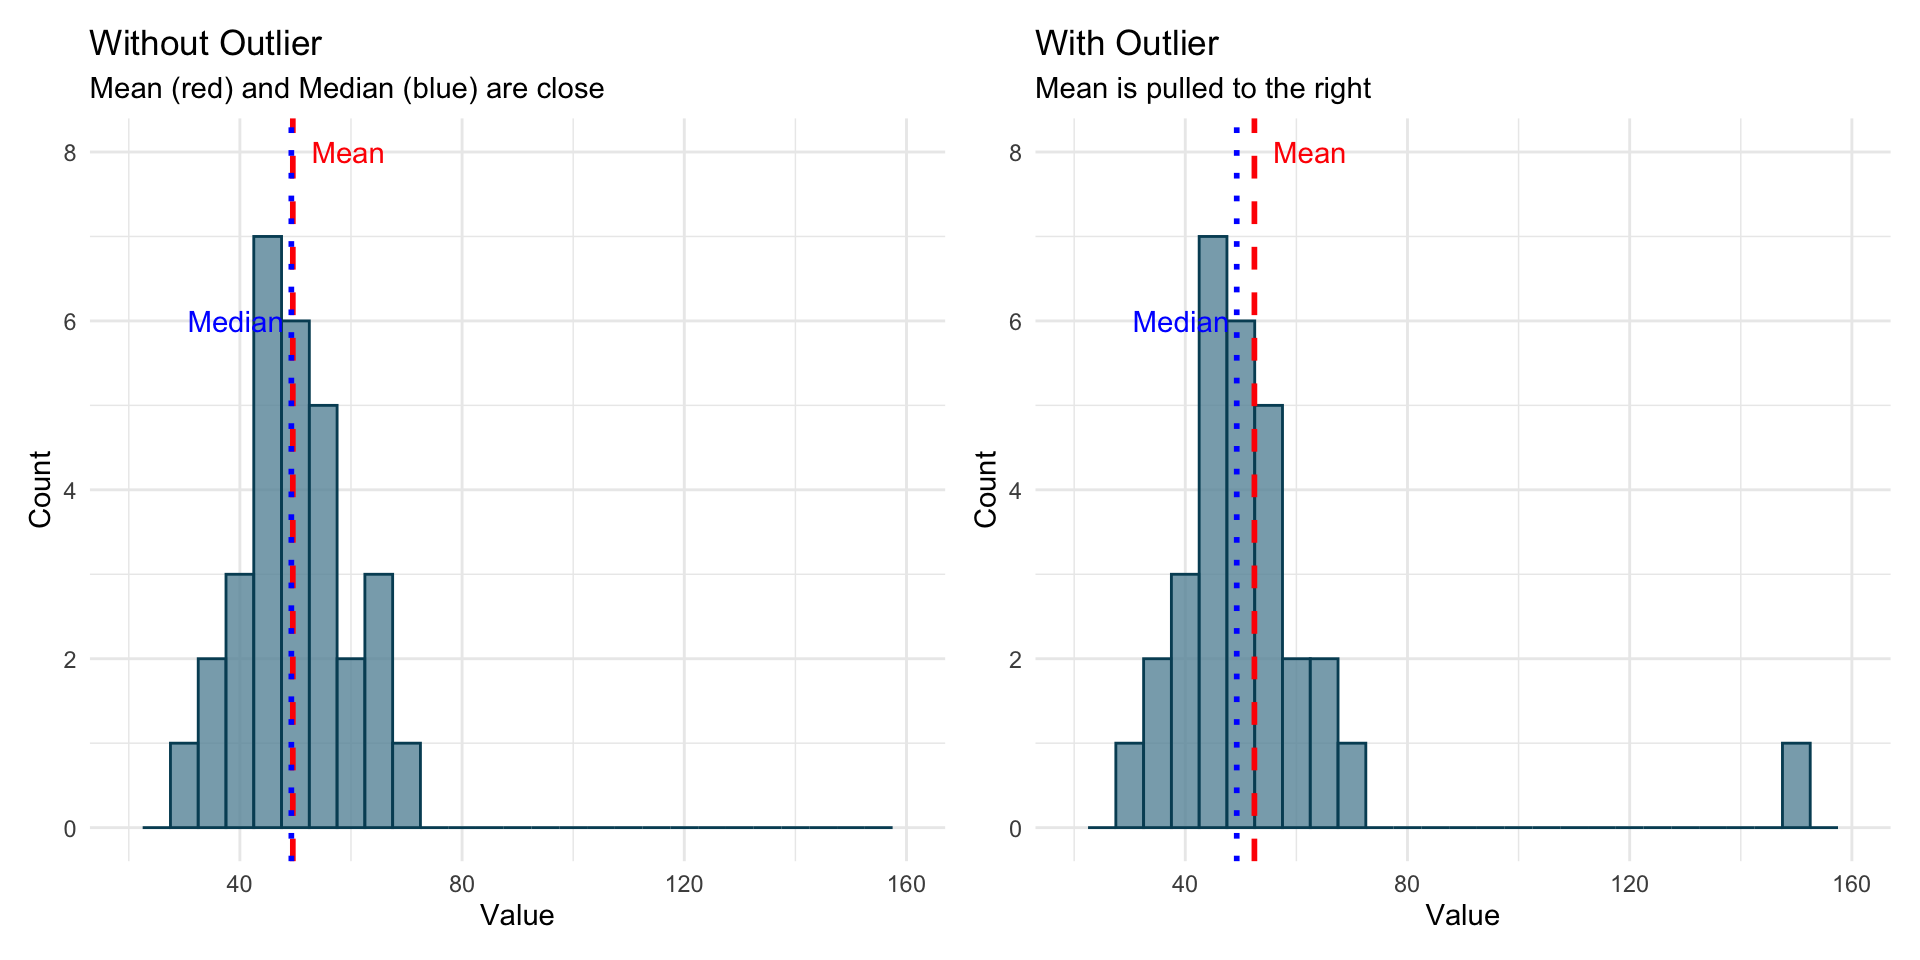
Mean vs. Median
- Note, however, that the mean is more sensitive to so called, “outliers”.
Mean vs. Median in R
Watch out for NAs
Use the na.rm argument and set it to TRUE to remove NAs
[1] NA[1] 2.5Spread
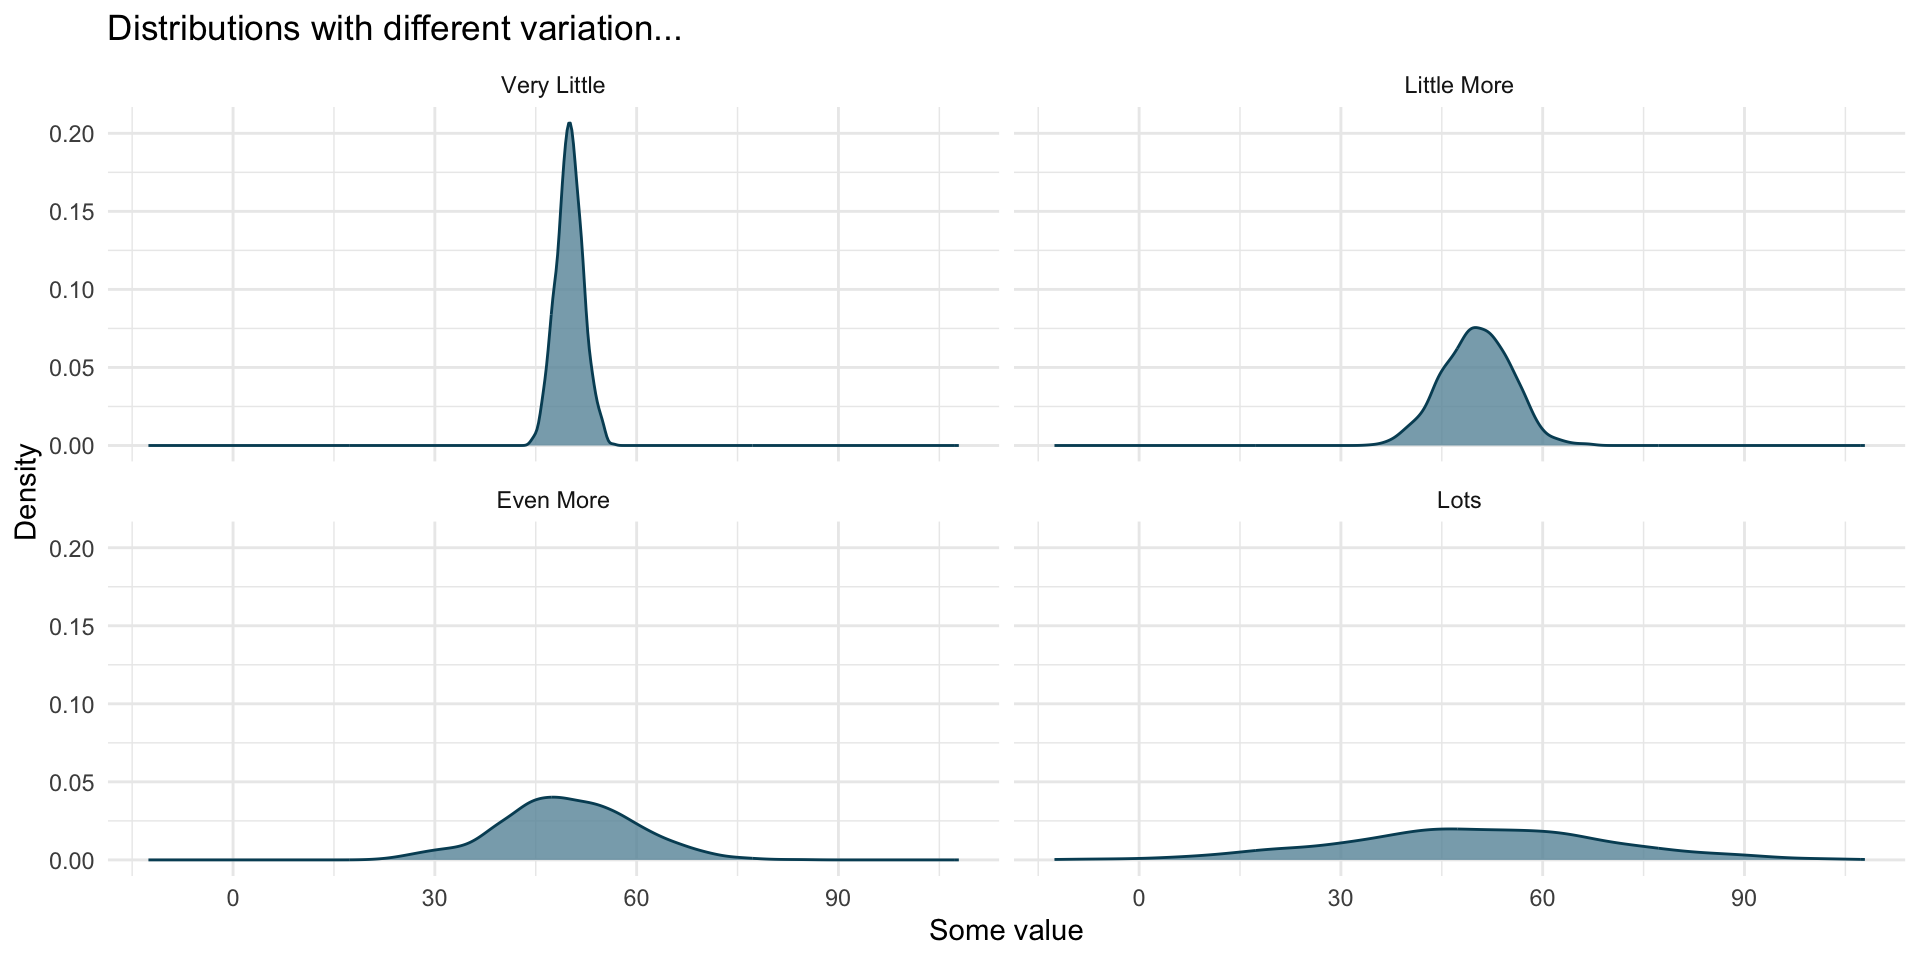
We do not only want to now the center of the distribution (mean, median), but also:
How wide is the distribution?
All these have the same mean, but they look quite different.
Range, quantiles, and the IQR
One simple way to quantify spread is by calculating the range
What would be the range ?
However, with outliers, the range is sometimes not ideal.
Range, quantiles, and the IQR
An alternative are quantiles
- The median divides the population into 2 groups of equal size
- Quartiles divide the population into 4 groups of equal size
- There are also terciles, quintiles, deciles, and so on
One way to compute quartiles: divide the ordered variable according to the median
- The lower quartile value is the median of the lower half of the data
- The upper quartile value is the median of the upper half of the data
- If there is an odd number of data points in the original ordered data set, don’t include the median in either half
| -3 | -2 | -1 | 0 | 1 | 2 | 3 |
\[Q_1 = -2,\:\:Q_2 = 0,\:\:Q_3 = 2\]
| -3 | -2 | -1 | 0 | 0 | 1 | 2 | 3 |
\[Q_1 = -1.5,\:\:Q_2 = 0,\:\:Q_3 = 1.5\]
Range, quantiles, and the IQR
The interquartile range is the difference between the third and the first quartile:
\(\text{IQR} = Q_3 - Q_1\)
In other words, it corresponds to the bounds of the set which contains the middle half of the distribution
Variance and standard deviation
The variance is a way to quantify how the values of a variable tend to deviate from their mean
- If values tend to be close to the mean, then the spread is low
- If values tend to be far from the mean, then the spread is large
Can we just take the average deviation from the mean?
| x | mean(x) | x - mean(x) |
|---|---|---|
| 1 | 2.5 | -1.5 |
| 4 | 2.5 | 1.5 |
| -3 | 2.5 | -5.5 |
| 8 | 2.5 | 5.5 |
By construction it would always be 0: values above and under the mean compensate
- But we can use the absolute value of each deviation: \(|x_i-\bar{x}|\)
- Or their square: \((x_i-\bar{x})^2\)
Variance and standard deviation
This is how the variance is computed: by averaging the squared deviations from the mean
\[\text{Var}(x) = \frac{1}{N}\sum_{i = 1}^N(x_i-\bar{x})^2\]
Because the variance is a sum of squares, it can get quite big compared to the other statistics like the mean, the median or the interquartile range.
To express the spread in the same unit as the data, we can take the square root of the variance, which is called the standard deviation
\[\text{SD}(x) = \sqrt{\text{Var}(x)} = \sqrt{\frac{1}{N}\sum_{i = 1}^N(x_i-\bar{x})^2}\]
Computing spread in R
Interquartile range (IQR)
Standard deviation (sd)