RCTs and Validity

library(tidyverse)
── Attaching core tidyverse packages ──────────────────────── tidyverse 2.0.0 ──
✔ dplyr     1.1.4     ✔ readr     2.1.5
✔ forcats   1.0.0     ✔ stringr   1.5.1
✔ ggplot2   3.5.1     ✔ tibble    3.2.1
✔ lubridate 1.9.3     ✔ tidyr     1.3.1
✔ purrr     1.0.2     
── Conflicts ────────────────────────────────────────── tidyverse_conflicts() ──
✖ dplyr::filter() masks stats::filter()
✖ dplyr::lag()    masks stats::lag()
ℹ Use the conflicted package (<http://conflicted.r-lib.org/>) to force all conflicts to become errors
library(kableExtra)

Attaching package: 'kableExtra'

The following object is masked from 'package:dplyr':

    group_rows
library(truncnorm)
library(broom)

Overview

  1. The magic of randomization

  2. How to analyze RCTs

  3. Validity

The magic of randomization

Fundamental problem of causal inference

  • Imagine we want to know if a treatment helps in quicker recovery of disease

  • Imagine there is only one patient, Angela

  • We could give Angela the treatment and see how quickly she gets better.

  • Or we could not give her the treatment and see how quickly she gets better.

Fundamental problem of causal inference

  • In either case, we’d want to know “What if…

  • “What if we had/had not given her the treatment”

  • This is also called a counterfactual - counter to the fact of what actually happened.

Solution: randomization and averages

  • Instead of only one patient, we need to look at several patients

  • If we randomly assign patients to a treatment and a control condition…

  • And if the sample is big enough…

  • Then people in these groups are on average the same on all imaginable variables (e.g. age, sex, income)

  • That’s the magic of randomization

Randomized Controlled Trials (RCTs)

How to analyze RCTs

Analyzing RCTs is very easy


Step 1: Check that key variables are balanced between control and treatment group

(this is something we’d expect from randomization, but with small samples you might get unlucky)


Step 2: Find difference in average outcome in treatment and control groups

Example RCT

imaginary_rct 
# A tibble: 800 × 6
   person treatment   age sex    recovery_time male_num
    <int> <chr>     <dbl> <chr>          <dbl>    <dbl>
 1      1 Treatment    23 Female         3.94         0
 2      2 Treatment    38 Male           4.84         1
 3      3 Treatment    46 Female        -2.07         0
 4      4 Treatment    12 Female         5.35         0
 5      5 Treatment    39 Male           3.04         1
 6      6 Treatment    40 Male           2.46         1
 7      7 Treatment    29 Female         6.32         0
 8      8 Treatment    30 Male           7.44         1
 9      9 Treatment    29 Female        -0.442        0
10     10 Treatment    26 Female         6.03         0
# ℹ 790 more rows

1. Check balance

imaginary_rct %>% 
  group_by(treatment) %>% 
  summarize(avg_age = mean(age),
            prop_male = mean(sex == "Male"))
# A tibble: 2 × 3
  treatment avg_age prop_male
  <chr>       <dbl>     <dbl>
1 Control      35.3      0.52
2 Treatment    35.1      0.52

2. Calculate difference

Group means

imaginary_rct %>% 
  group_by(treatment) %>% 
  summarize(avg_outcome = round(mean(recovery_time), digits = 2))
# A tibble: 2 × 2
  treatment avg_outcome
  <chr>           <dbl>
1 Control          6.04
2 Treatment        2.9 
2.90 - 6.04
[1] -3.14

Regression

rct_model <- lm(recovery_time ~ treatment, 
                data = imaginary_rct)

tidy(rct_model) |> 
  select(estimate, statistic, p.value)
# A tibble: 2 × 3
  estimate statistic   p.value
     <dbl>     <dbl>     <dbl>
1     6.04      40.4 6.84e-195
2    -3.15     -14.9 2.84e- 44

Your turn: Analyzing an RCT

Imagine an NGO is planning on launching a training program designed to boost incomes.

They ran a study on 1,000 participants over the course of 6 months and you just got your data back.

  1. Download and read the data set (either here: village_randomized.csv, or from this week’s content on the course website)

  2. Before calculating the effect of the program, first check how well balanced the random assignment was.

  3. Estimate the treatment effect. This is simply the average outcome for people in the program minus the average outcome for people not in the program.

countdown::countdown(
  minutes = 15,
  bottom = 0, 
  right = 0,
  # Fanfare when it's over
  play_sound = FALSE,
  color_border              = "#FFFFFF",
  color_text                = "#7aa81e",
  color_running_background  = "#7aa81e",
  color_running_text        = "#FFFFFF",
  color_finished_background = "#ffa07a",
  color_finished_text       = "#FFFFFF",
  font_size = "1em",
  start_immediately = TRUE
  )
15:00

Solution

  1. Download and read the data set
# read data
village_randomized <- read_csv("data/village_randomized.csv")
Rows: 1000 Columns: 8
── Column specification ────────────────────────────────────────────────────────
Delimiter: ","
chr (2): sex, program
dbl (6): id, age, pre_income, post_income, sex_num, program_num

ℹ Use `spec()` to retrieve the full column specification for this data.
ℹ Specify the column types or set `show_col_types = FALSE` to quiet this message.

Solution

  1. Before calculating the effect of the program, first check how well balanced the random assignment was.
village_randomized |>
  group_by(program) |>
  summarize(
    n = n(),
    prop_male = mean(sex_num),
    avg_age = mean(age),
    avg_pre_income = mean(pre_income)
    ) |> 
  # this rounds all numeric variables in the data frame to two digits
  mutate_if(is.numeric, ~ round(.x, digits = 2)) 
# A tibble: 2 × 5
  program        n prop_male avg_age avg_pre_income
  <chr>      <dbl>     <dbl>   <dbl>          <dbl>
1 No program   503      0.58    34.9           803.
2 Program      497      0.6     34.9           801.

Solution

  1. Estimate the treatment effect. This is simply the average outcome for people in the program minus the average outcome for people not in the program.
# for descriptive findings
village_randomized |>
  group_by(program) |>
  summarize(avg_post = mean(post_income))
# A tibble: 2 × 2
  program    avg_post
  <chr>         <dbl>
1 No program    1180.
2 Program       1279.
# as a regression
model_rct <- lm(post_income ~ program, data = village_randomized)
tidy(model_rct)
# A tibble: 2 × 5
  term           estimate std.error statistic  p.value
  <chr>             <dbl>     <dbl>     <dbl>    <dbl>
1 (Intercept)      1180.       4.27     276.  0       
2 programProgram     99.2      6.06      16.4 1.26e-53

Validity

There are many different threats to validity

The overarching question is always the same:


Can we draw valid conclusions about our research question from the data we have?

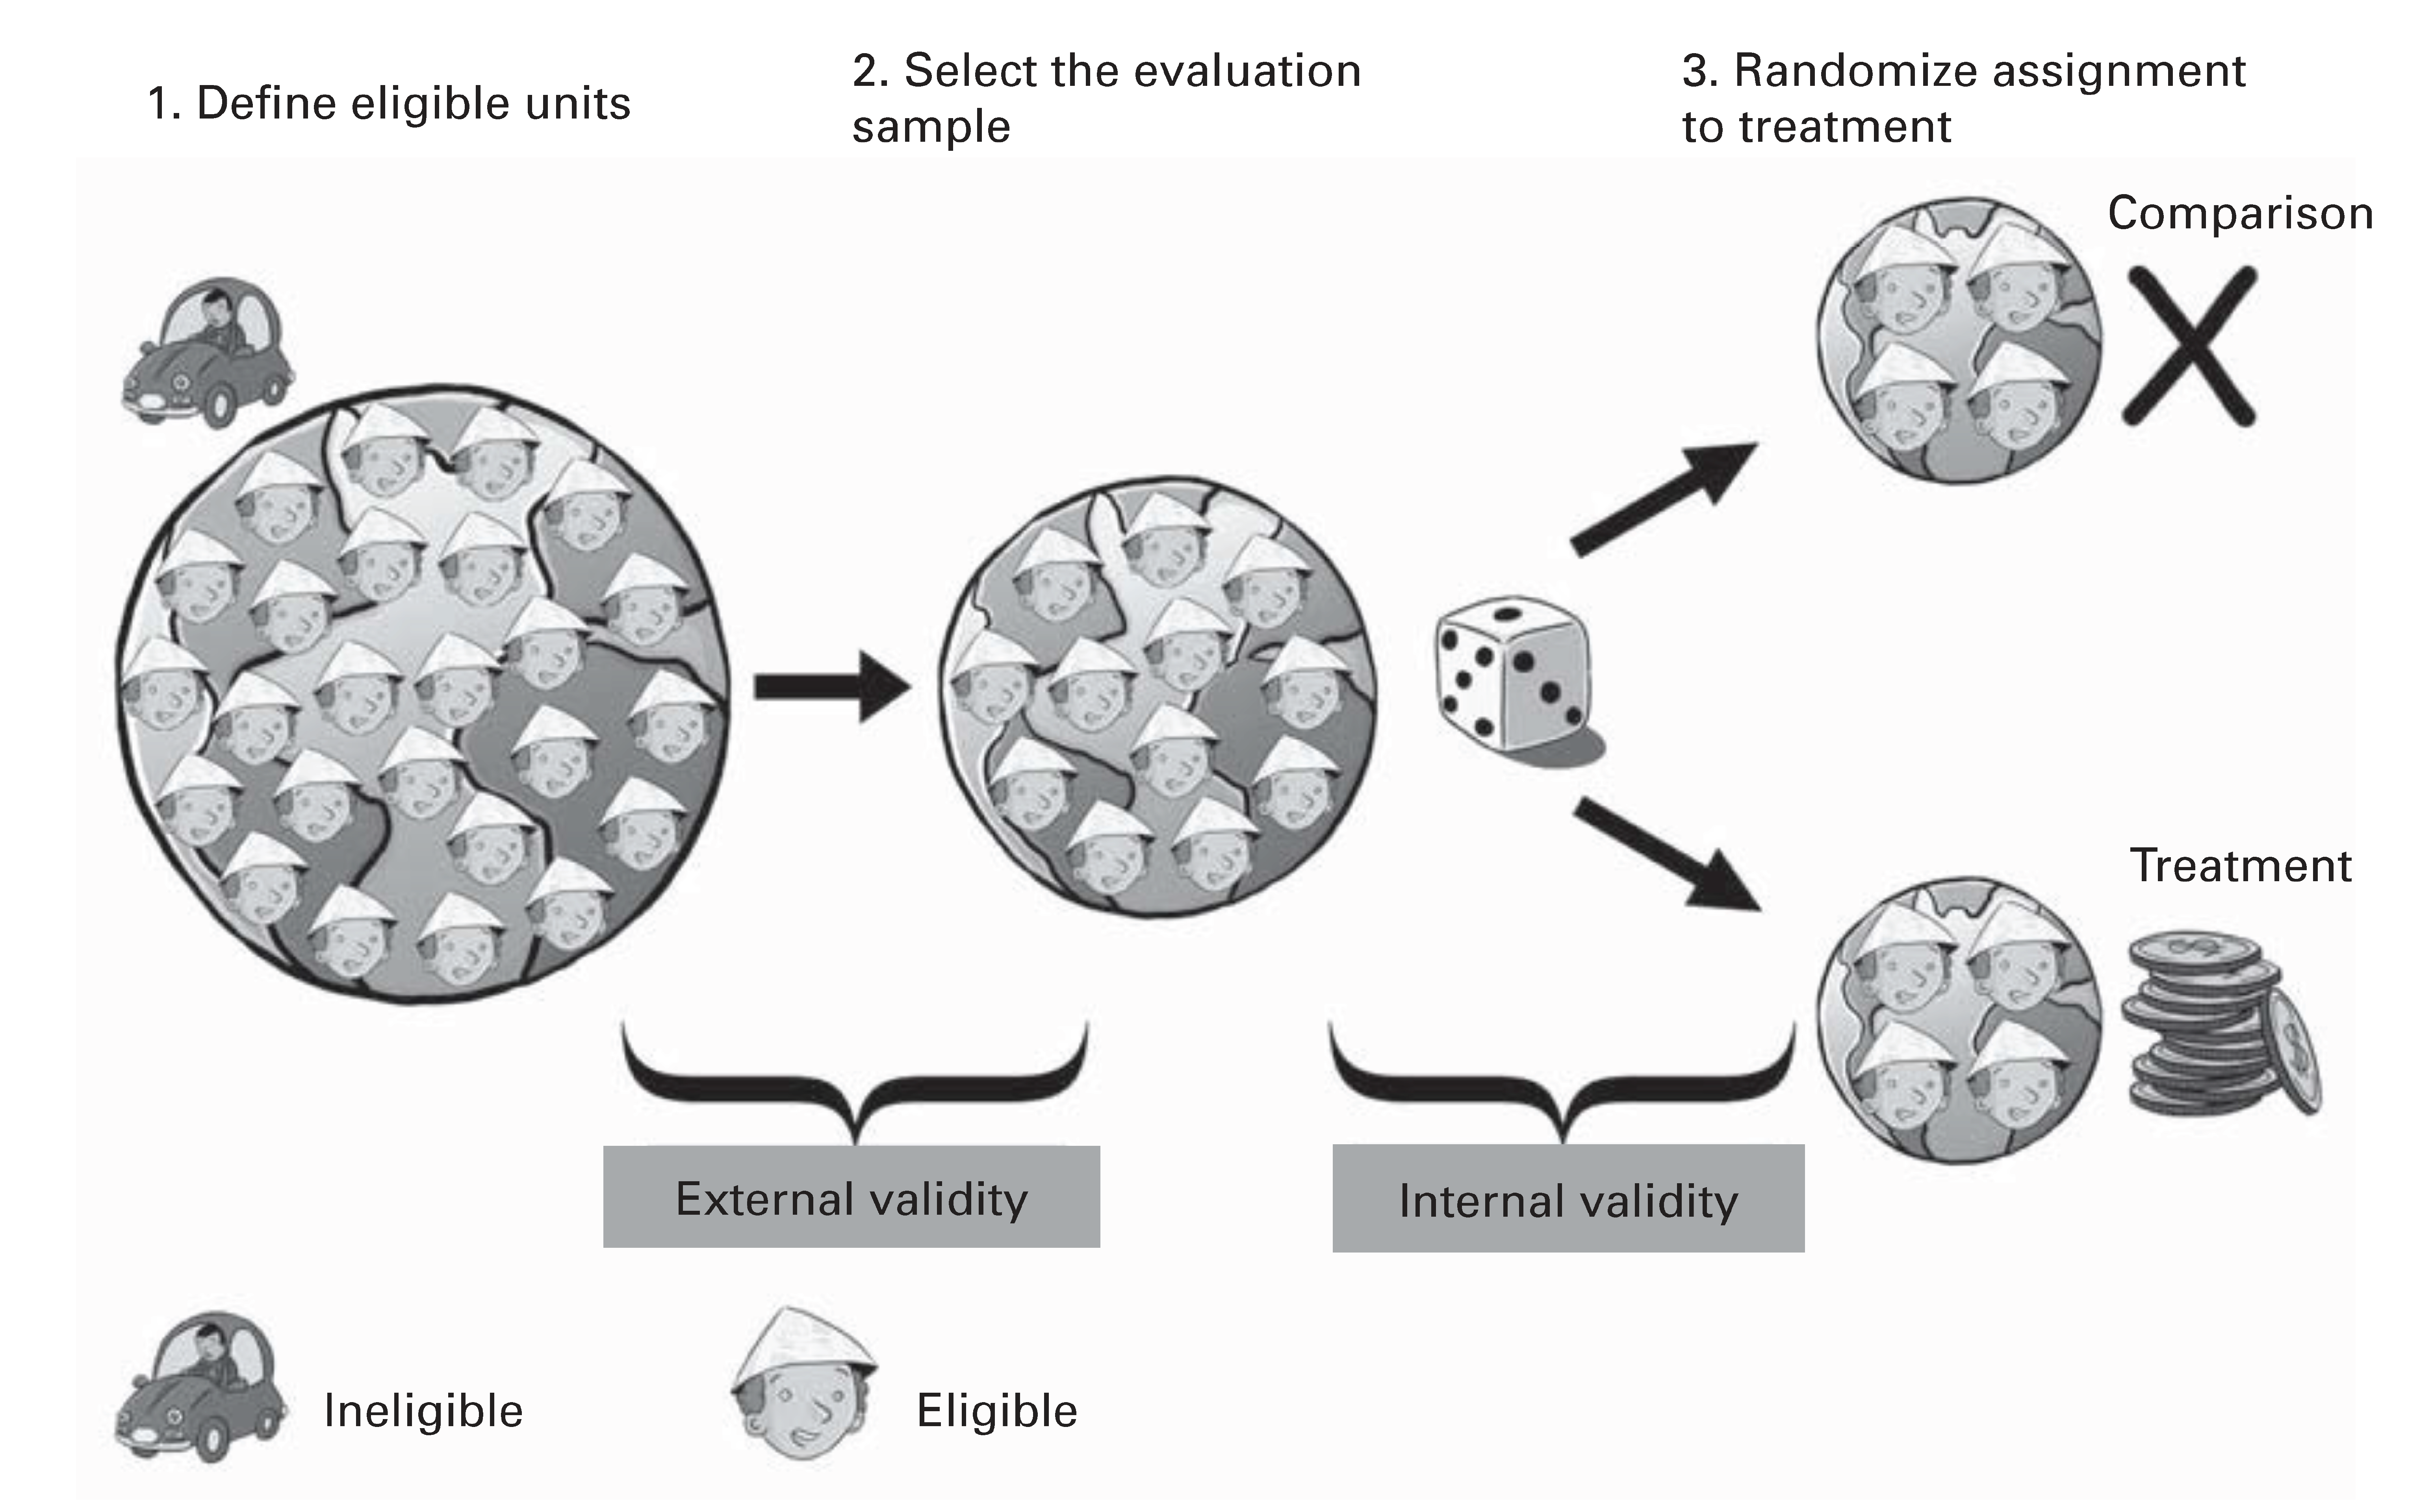
External vs. internal validity

Internal validity

“How well does our research design in identify the (causal) effect we are looking for?”


RCTs allows us to establish (valid) causality, but it is not immune to everything…

  • (Self-)selection
  • Attrition
  • Hawthorne
  • John Henry
  • Spillovers
  • Intervening events

Self-selection

  • If people can choose to enroll in a program, those who enroll will be different from those who do not


How to fix it?

  • Make sure randomization is happening correctly

Attrition

If the people who leave a program or study are different than those who stay, the effects will be biased


How to fix it?

  • Check characteristics of those who stay and those who leave

Hawthorne effect

Observing people makes them behave differently


How to fix it?

  • Hide? A tough fix…

John Henry effect

Control group works hard to prove they’re as good as the treatment group


How to fix it?

  • Keep two groups separate

Spillover effects

Control groups are sometimes naturally affected by what the treatment group is getting

e.g. vaccine distribution in global south


How to fix it?

  • Keep two groups separate; use distant control groups

External validity

“Are our findings generalizable to the population we care about?”


Lab conditions vs. real world

  • Most study volunteers are weird

  • Western, educated, from industrialized. rich, and democratic countries

Validity wrap-up

  • RCTs are also vulnerable to some threats of internal validity

  • RCTs definitely don’t magically fix external validity

That’s it for today :)