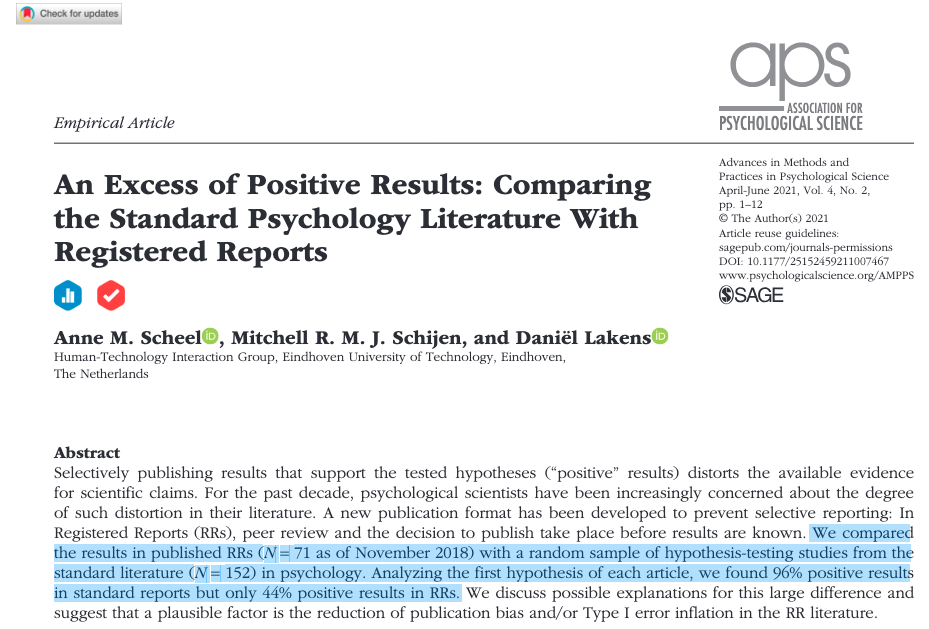
10:00
Scientific Publishing and the Replication Crisis

If I have seen further than others,
it is by standing upon the shoulders
of giants.
— Isaac Newton
(A typical textbook) pyramid of evidence
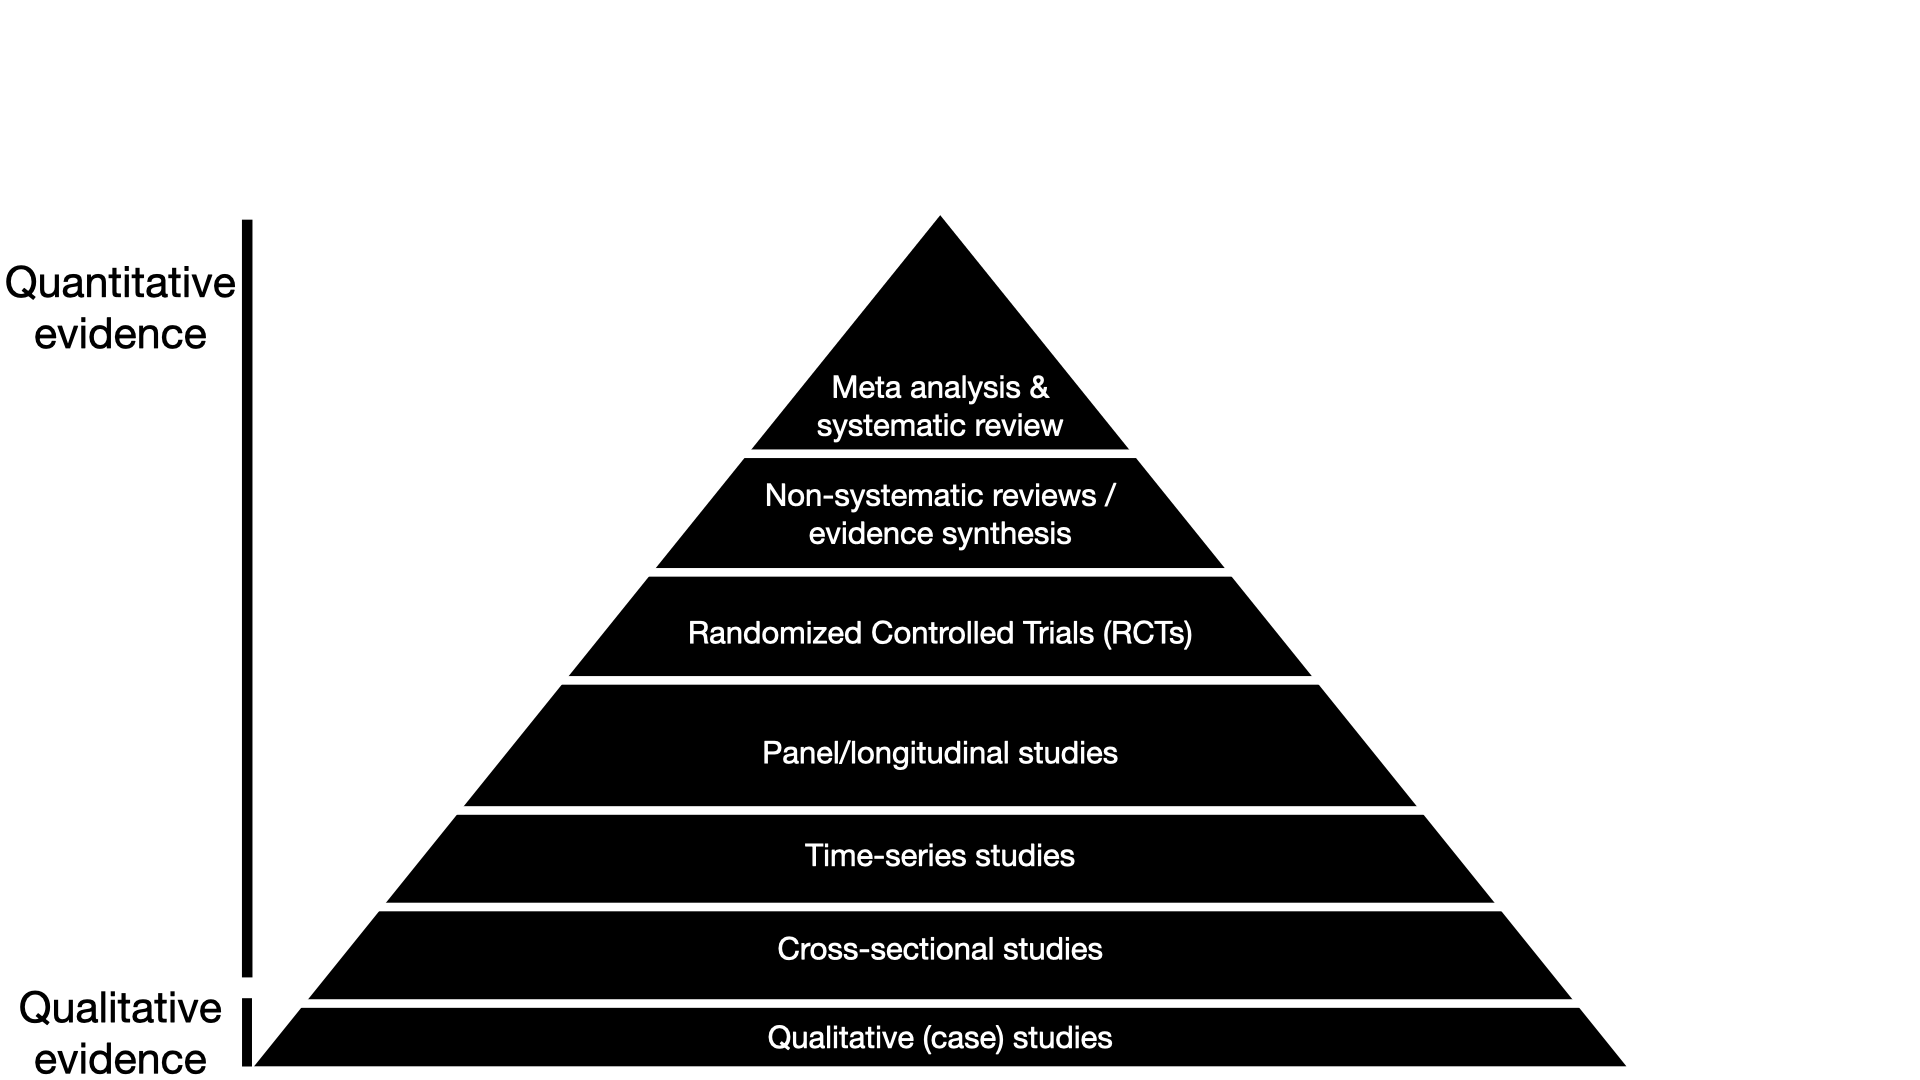
Confusing!
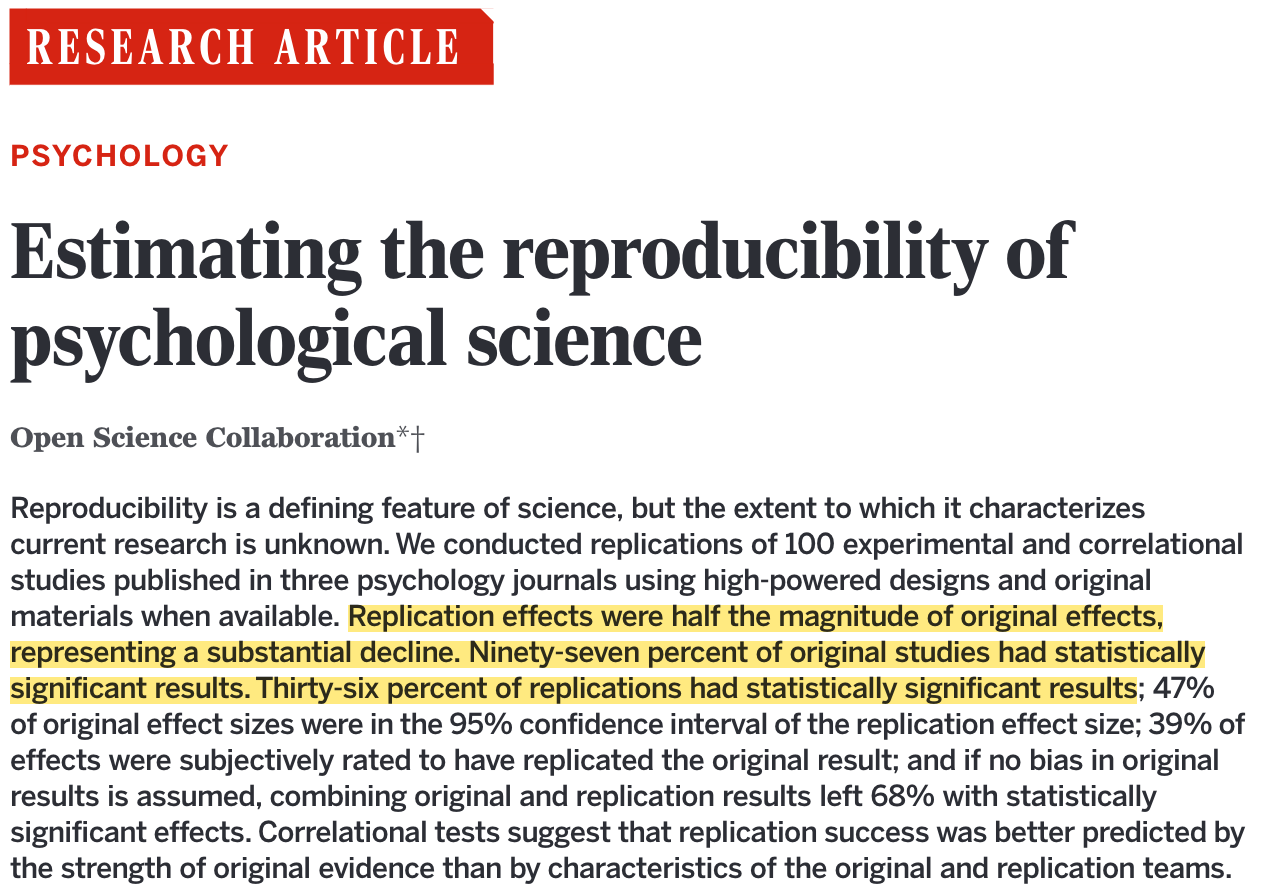
The paper uses the word “reproducibility”, but in fact they replicated studies.
That is, they collected new data.
To Illustrate how easy p-hacking is, the authors ran an RCT.
They found that listening to the classic Beatles song “When I’m Sixty-Four” makes people younger
(Yes, it literally reversed time)
- All analysis were using sound statistical methods and randomization
How did they achieve it?
- Just like you in the exercise: p-hacking
- They collected information about a number of characteristics of their study subjects, and then controlled for one that happened to give them the result they were looking at. (The age of the subject’s father).
- They also continued the experiment until they got a significant result, rather than predetermining the sample size.
File-drawer effect
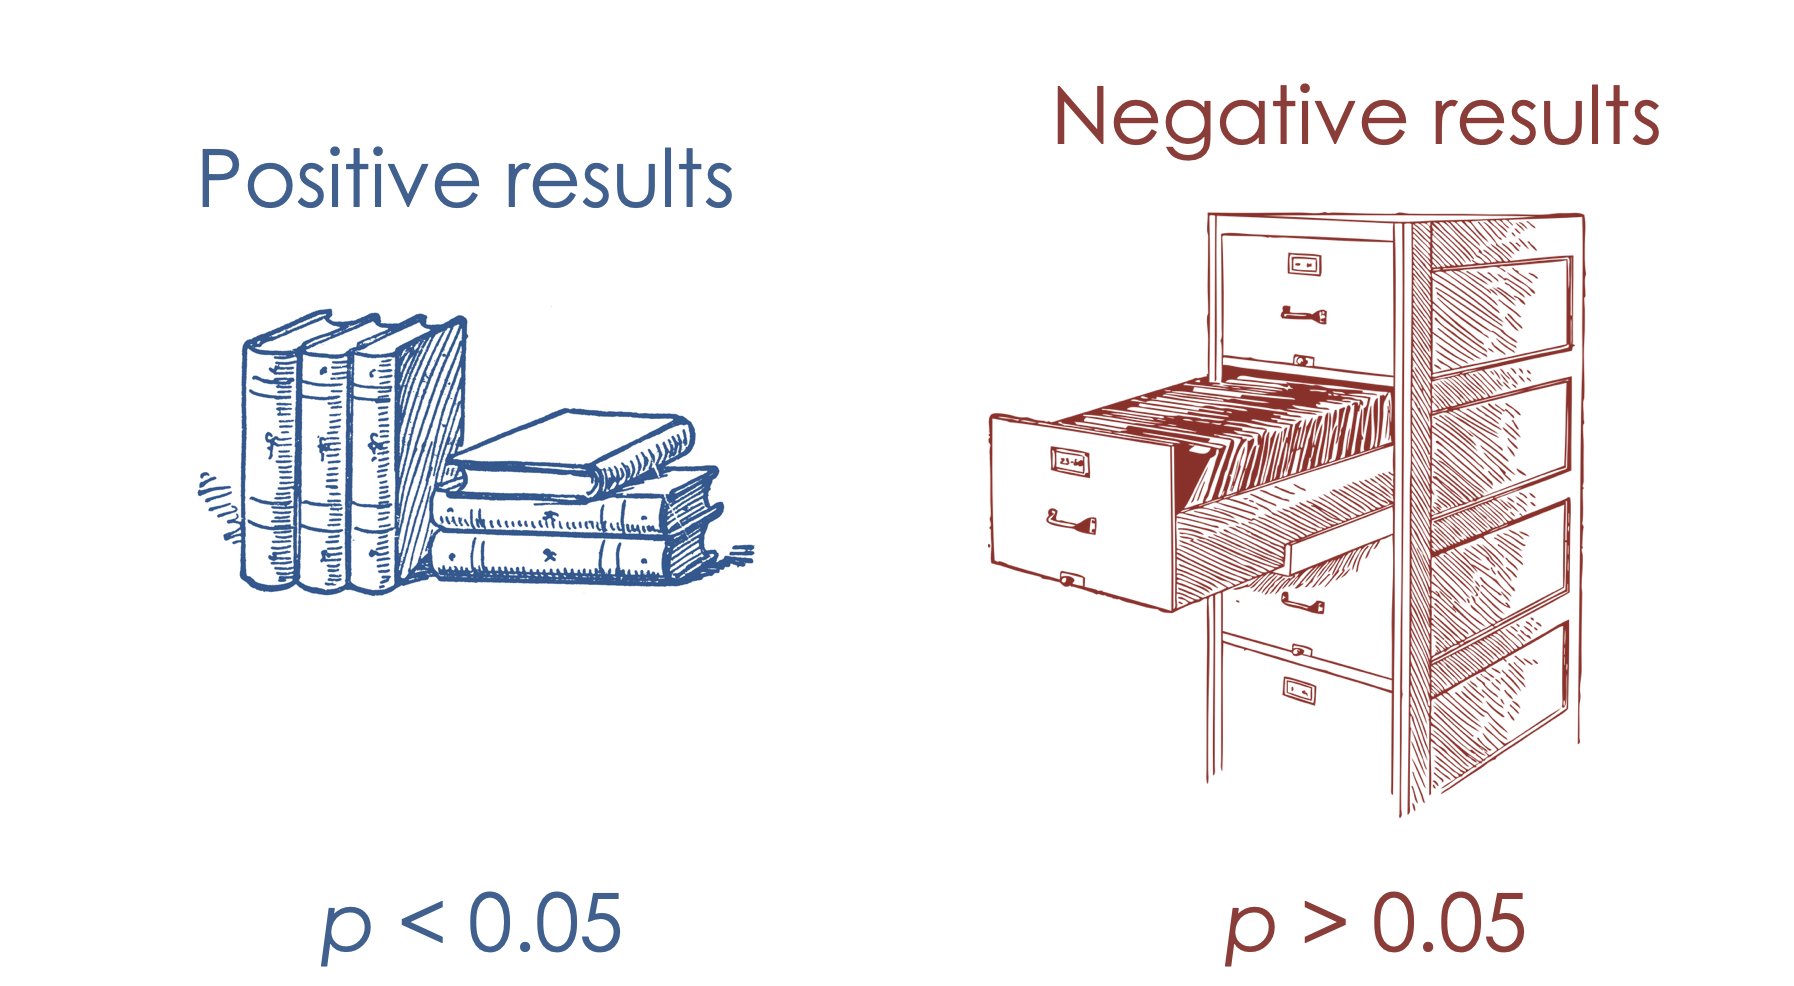
Illustration from Calling Bullshit
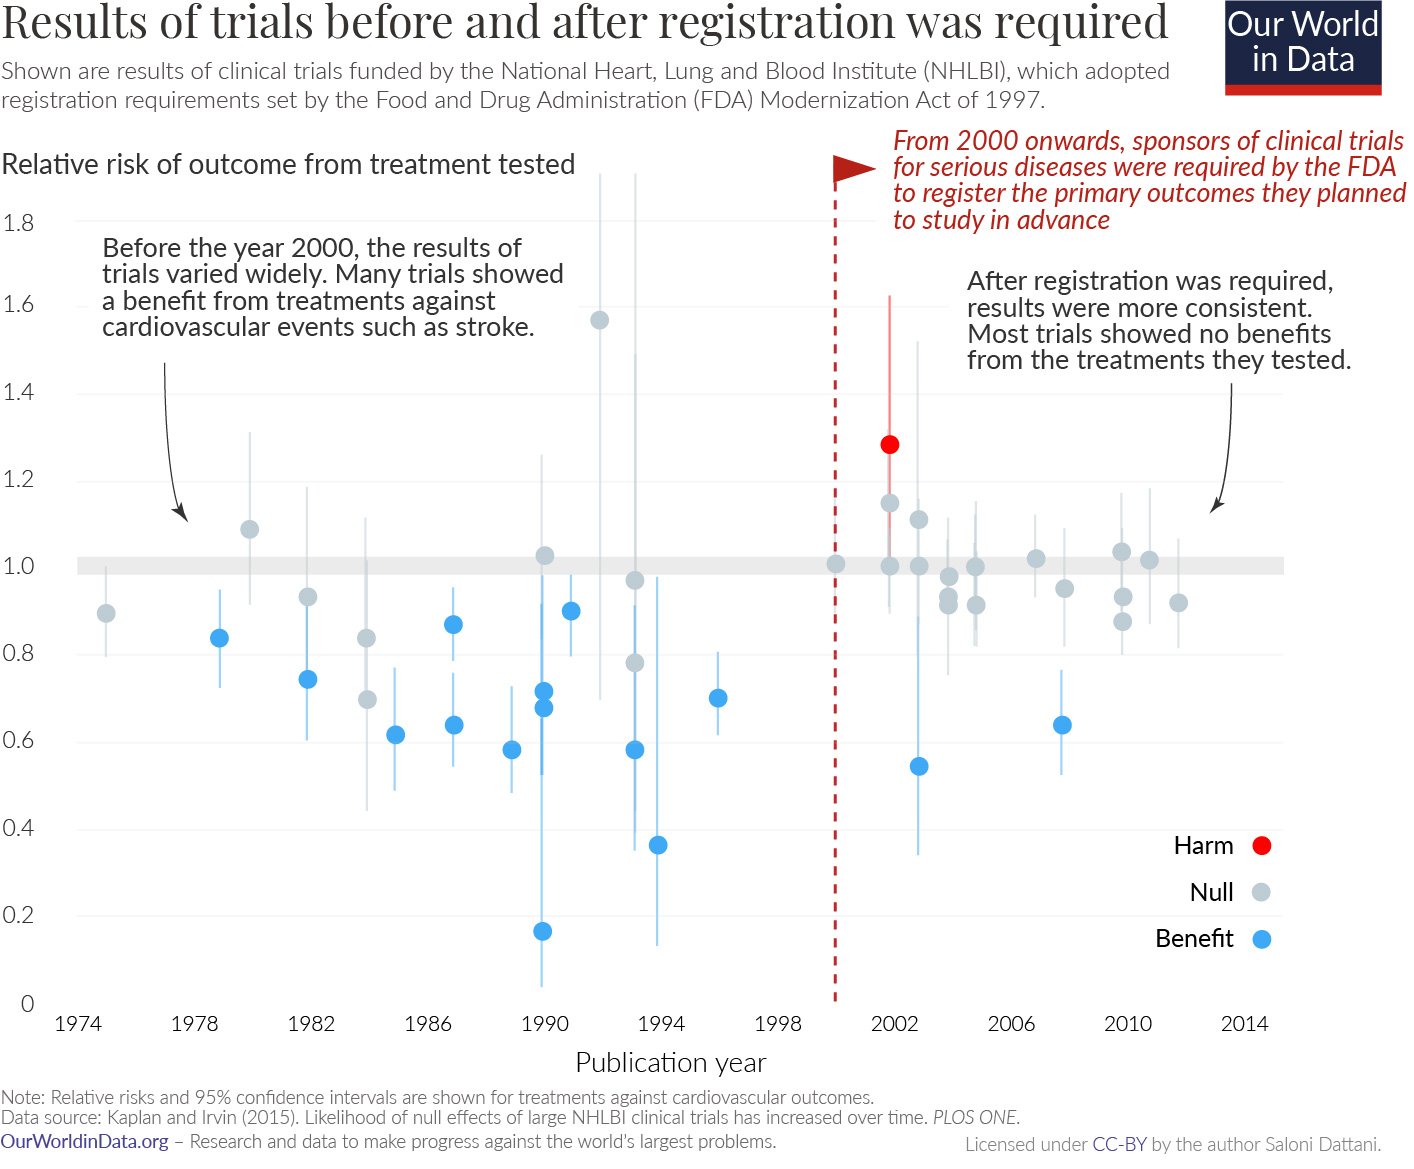
How bad is the issue?
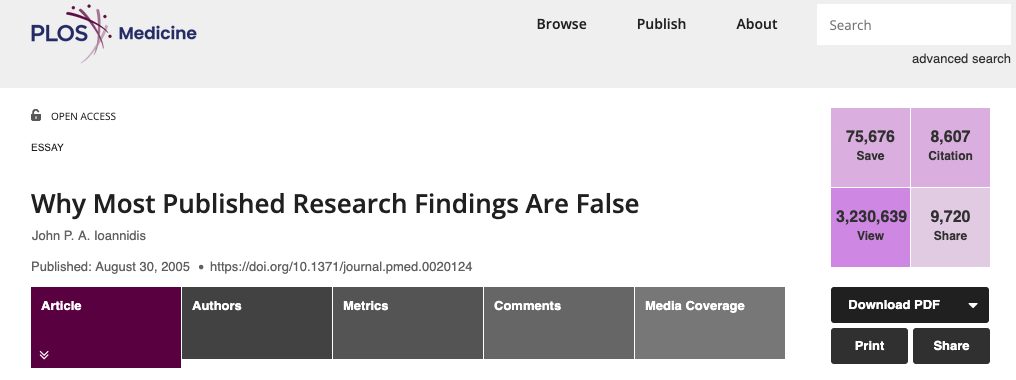
This is Ioannidis’ argument:
If we assume that
scientists test implausible hypotheses
and that only a fraction of negative results gets reported
then most of research findings are wrong (i.e. low PPV).
This is likely an overestimation of the problem!
One can argue with Ioannidis’ assumptions.
Also, the paper is old (2005), and many things have changed for the better since.
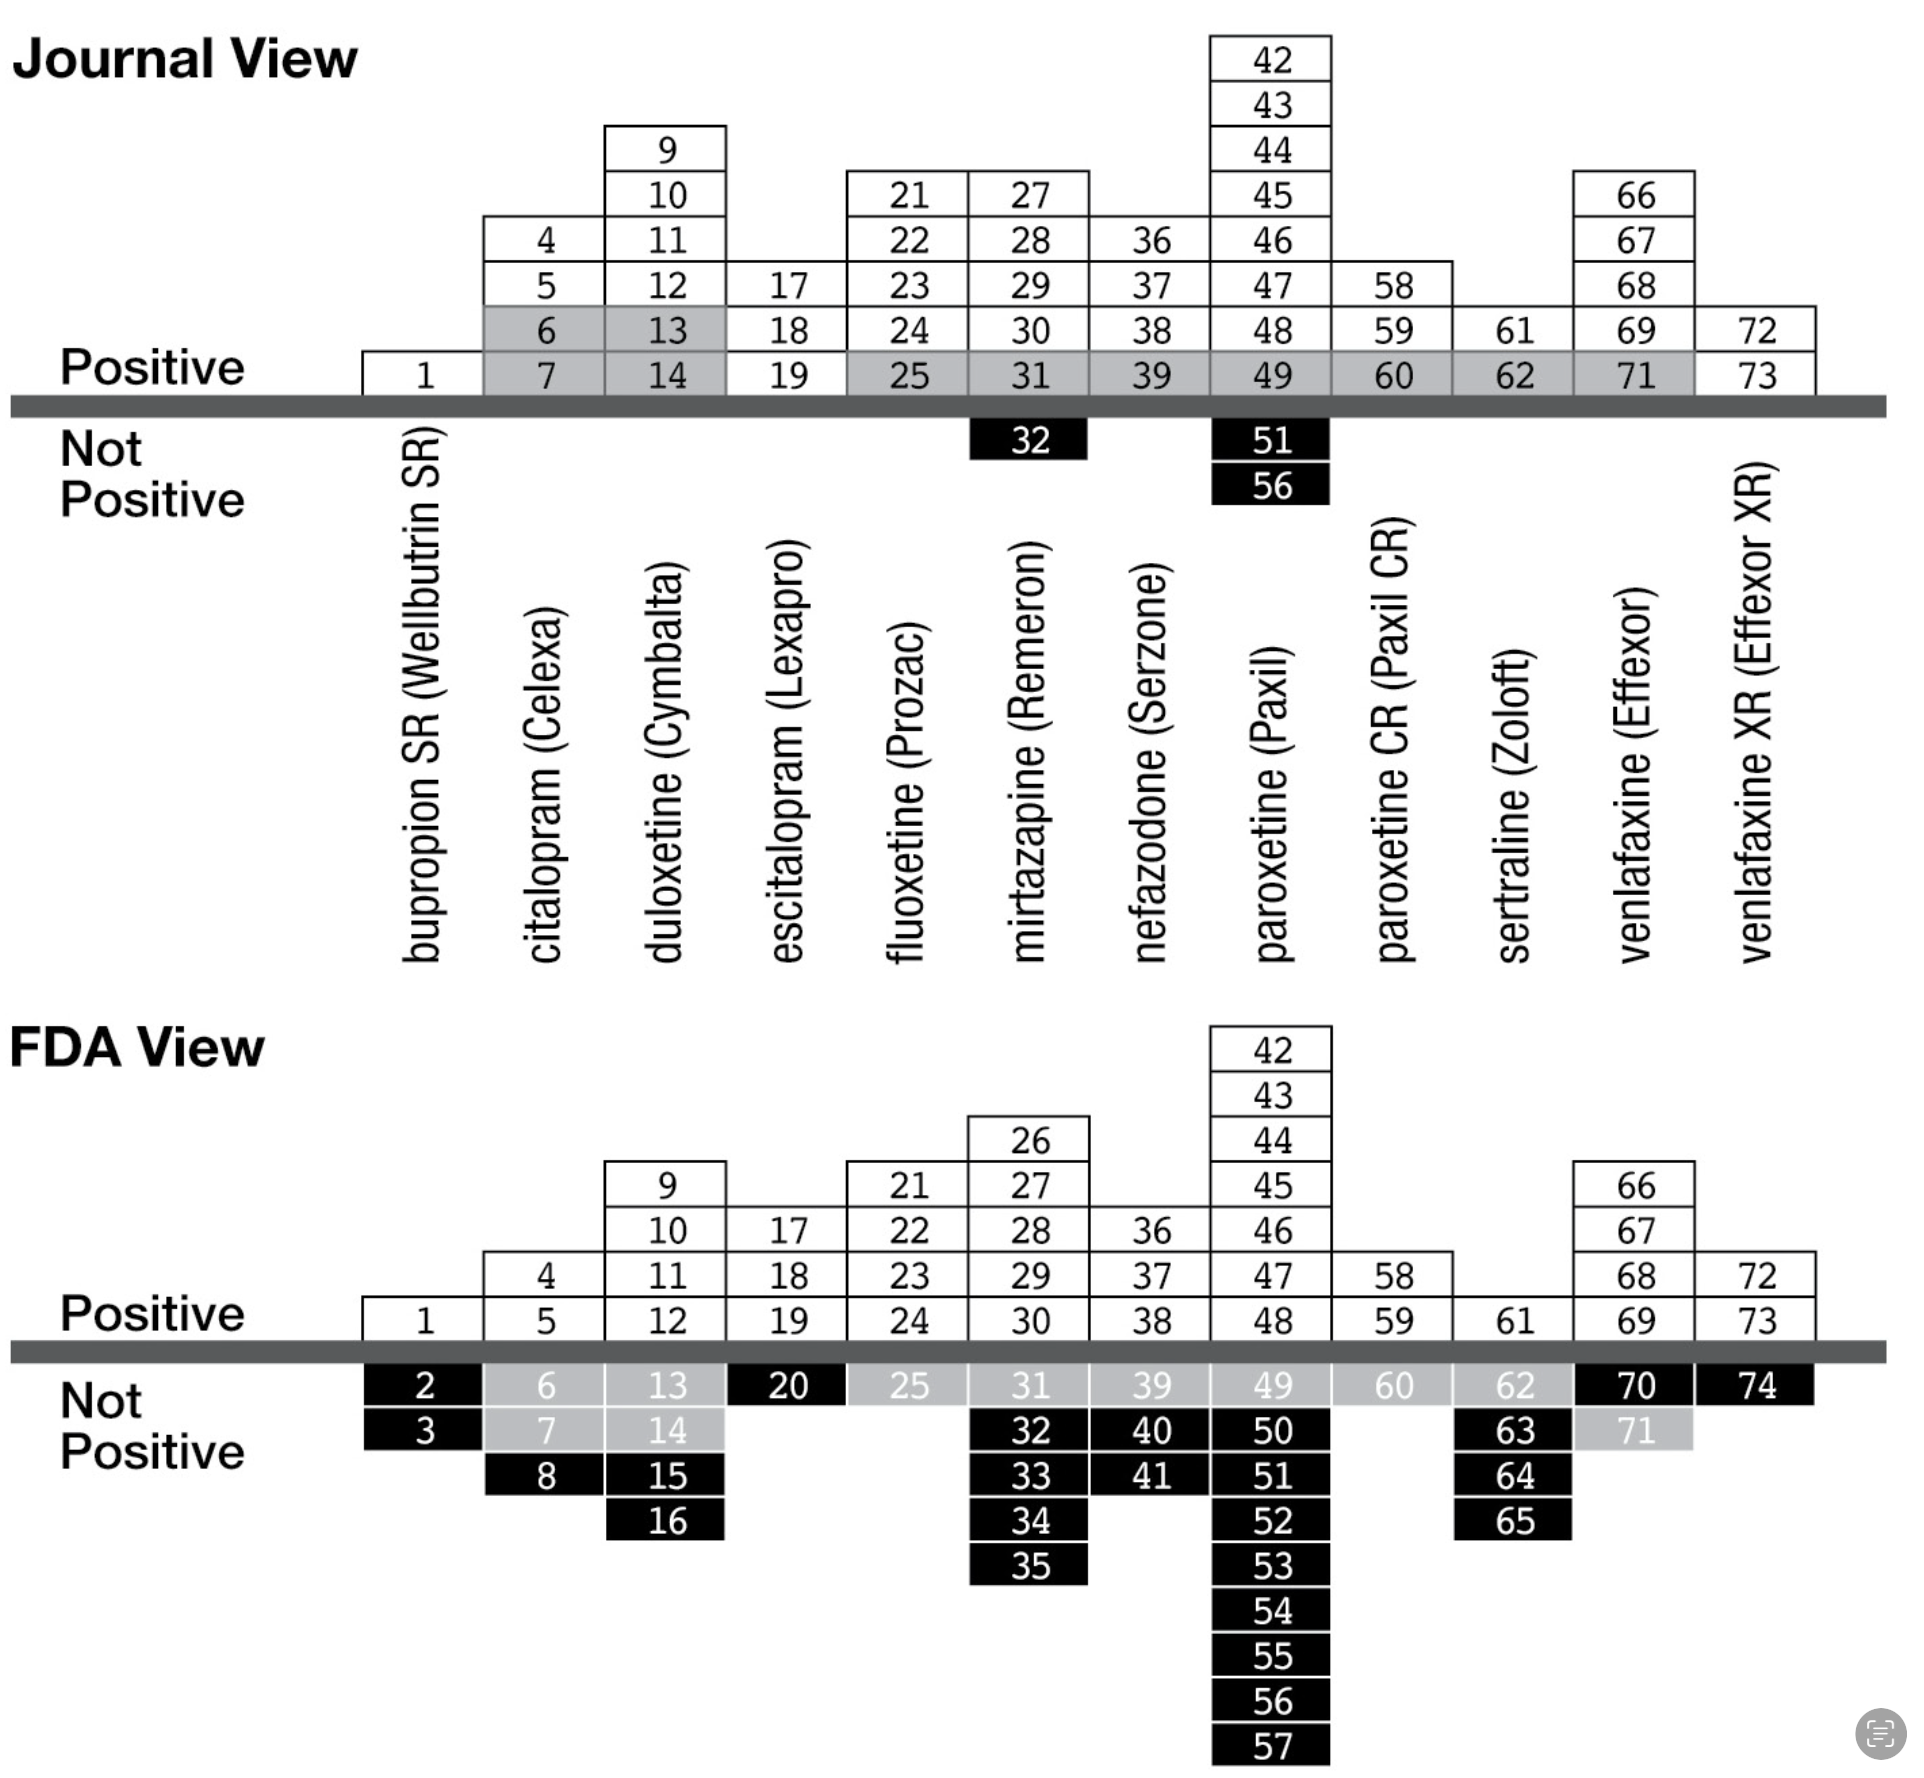
Illustration from Bergstrom, C. T., & West, J. D. (2020). Calling bullshit: The art of skepticism in a data-driven world (First edition). Random House.
This is something you’ve learned by using Quarto! 🎉
![]()
How exactly does it work?
![]()
There are different options but the most common one is to use the Open Science Framework (OSF)
large number of templates
all participating authors get informed and can cancel within 48h
prereg can be kept privat for a while (if needed to protect the project)
Registered reports

journals commit to publishing results, no matter whether significant or not
relevance of a study is determined based on the research question, not the result