Class 1: Introduction to R, Rstudio and Quarto
Slides
The slides are available online as an HTML file. You can also download them in a static PDF (for printing or storing for later). You can also click in the slides below and navigate through them with your left and right arrow keys.
Data
Readings
- Chapters 2, 6 and 7 in Wickham, Çetinkaya-Rundel, and Grolemund (2023)
Assignment
Task 1
Get familiar with the syllabus of this course.
Task 2
Read the guide “Welcome to R, RStudio, and the tidyverse” on installation and install R, Rstudio, tidyverse (we’ll talk more about that soon) and tinytex.
Task 3
Read the guide on Rprojects, including the reference to this short chapter.
Task 4
Create an RStudio Project.
Create a folder named “data” in the project folder you just made.
Download this CSV file and place it in that folder:
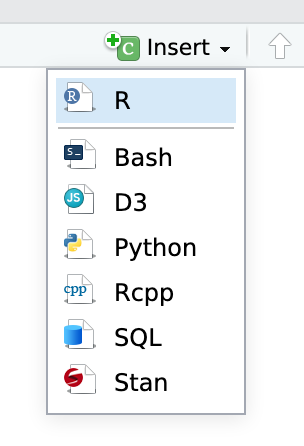
In RStudio, go to “File” > “New File…” > “Quarto Document…” and click “OK” in the dialog without changing anything.
Delete all the placeholder text in that new file and replace it by copy-pasting this:
---
title: "Problem set 1"
author: "Put your name here"
format:
  html:
    toc: true
  pdf:
    toc: true
  docx:
    toc: true
---

```{r packages}
library(tidyverse)
```

# Learning R

[Give me some Feedback on how the this first class went.]

[WRITE SOMETHING HERE LIKE "It was not so hard and I managed to get it all done" or whatever.]

# Read the data

> Read the `cars.csv` data into R. Make sure to use the correct path ("data/cars.csv"). Name the data frame "cars" when reading it in. You don't need to understand what all the variables mean.

[PUT CHUNK HERE]

# What's the class of the `model` and the `year` variable?

[PUT CHUNK HERE]

> Subset the cars data by selecting only rows that correspond to the manufacturer "honda" and that shows only the columns for models and the year. Name that subset "honda_data" and print it.

[PUT CHUNK HERE]

# My first plots

> You haven't learned about plots yet. But to give you a taste for what's coming, execute the code chunk below and let the magic happen. Make sure your data frame is named "cars" for this to work

A plot on the distance that cars can travel per gallon. Note that we will hide the code when rendering by setting `echo: false`.

```{r plot-data}
#| echo: false
ggplot(cars, aes(x = hwy)) +
geom_histogram() +
labs(
title = "A Histogram",
x = "Higway MPG*",
caption = "*miles per gallon, is the distance, measured in miles, that a car can travel per gallon of fuel."
)
```
Save the Quarto file with some sort of name (without any spaces!)
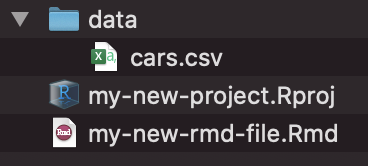
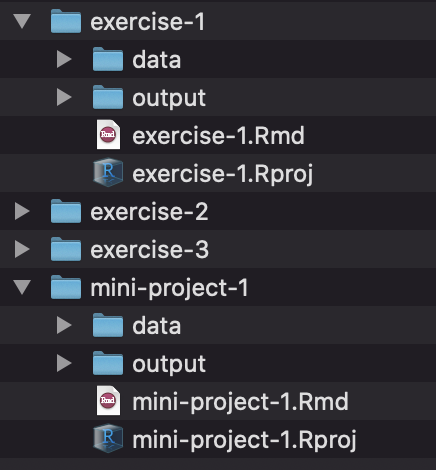
Your project folder should look something like this:
Task 5
Work with R:
- Remove all the place holder text indicated by
[ ].
Follow the instructions for the three chunks of code.
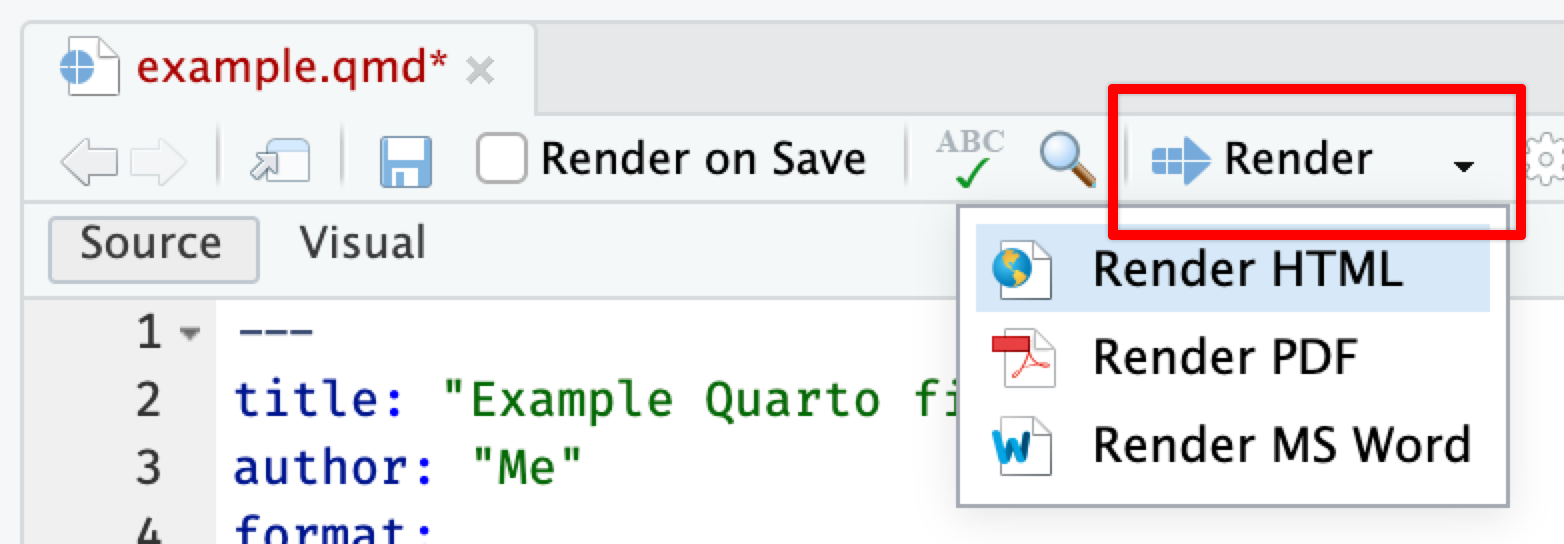
Render your document, either as a
.pdfor a.htmlfile. Use the “Render” menu:
Upload the rendered document in the Homework section on Moodle, under “Assignment 1”.
🎉 Party! 🎉
Tip
You’ll be doing this same process for all your future problem sets. Each problem set will involve a Quarto file. You can either create a new RStudio Project directory for all your work:
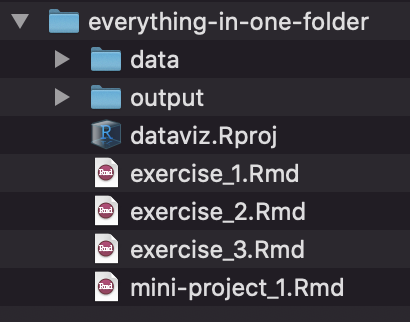
Or you can create individual projects for each assignment and project:
Solution
References
Wickham, Hadley, Mine Çetinkaya-Rundel, and Garrett Grolemund. 2023. R for data science: import, tidy, transform, visualize, and model data. 2nd edition. Beijing Boston Farnham Sebastopol Tokyo: O’Reilly. https://r4ds.hadley.nz/.